Introduction
AWS defines AWS IoT as a set of managed services that enable ‘internet-connected devices to connect to the AWS Cloud and lets applications in the cloud interact with internet-connected devices.’ AWS IoT services span three categories: Device Software, Connectivity and Control, and Analytics. In this post, we will focus on AWS IoT Analytics, one of four services, which are part of the AWS IoT Analytics category. According to AWS, AWS IoT Analytics is a fully-managed IoT analytics service, designed specifically for IoT, which collects, pre-processes, enriches, stores, and analyzes IoT device data at scale.
Certainly, AWS IoT Analytics is not the only way to analyze the Internet of Things (IoT) or Industrial Internet of Things (IIoT) data on AWS. It is common to see Data Analyst teams using a more general AWS data analytics stack, composed of Amazon S3, Amazon Kinesis, AWS Glue, and Amazon Athena or Amazon Redshift and Redshift Spectrum, for analyzing IoT data. So then why choose AWS IoT Analytics over a more traditional AWS data analytics stack? According to AWS, IoT Analytics was purpose-built to manage the complexities of IoT and IIoT data on a petabyte-scale. According to AWS, IoT data frequently has significant gaps, corrupted messages, and false readings that must be cleaned up before analysis can occur. Additionally, IoT data must often be enriched and transformed to be meaningful. IoT Analytics can filter, transform, and enrich IoT data before storing it in a time-series data store for analysis.
In the following post, we will explore the use of AWS IoT Analytics to analyze environmental sensor data, in near real-time, from a series of IoT devices. To follow along with the post’s demonstration, there is an option to use sample data to simulate the IoT devices (see the ‘Simulating IoT Device Messages’ section of this post).
IoT Devices
In this post, we will explore IoT Analytics using IoT data generated from a series of custom-built environmental sensor arrays. Each breadboard-based sensor array is connected to a Raspberry Pi single-board computer (SBC), the popular, low cost, credit-card sized Linux computer. The IoT devices were purposely placed in physical locations that vary in temperature, humidity, and other environmental conditions.

Each device includes the following sensors:
- MQ135 Air Quality Sensor Hazardous Gas Detection Sensor: CO, LPG, Smoke (link)
(requires an MCP3008 – 8-Channel 10-Bit ADC w/ SPI Interface (link)) - DHT22/AM2302 Digital Temperature and Humidity Sensor (link)
- Onyehn IR Pyroelectric Infrared PIR Motion Sensor (link)
- Anmbest Light Intensity Detection Photosensitive Sensor (link)

AWS IoT Device SDK
Each Raspberry Pi device runs a custom Python script, sensor_collector_v2.py. The script uses the AWS IoT Device SDK for Python v2 to communicate with AWS. The script collects a total of seven different readings from the four sensors at a regular interval. Sensor readings include temperature, humidity, carbon monoxide (CO), liquid petroleum gas (LPG), smoke, light, and motion.
The script securely publishes the sensor readings, along with a device ID and timestamp, as a single message, to AWS using the ISO standard Message Queuing Telemetry Transport (MQTT) network protocol. Below is an example of an MQTT message payload, published by the collector script.
This file contains bidirectional Unicode text that may be interpreted or compiled differently than what appears below. To review, open the file in an editor that reveals hidden Unicode characters.
Learn more about bidirectional Unicode characters
| { | |
| "data": { | |
| "co": 0.006104480269226063, | |
| "humidity": 55.099998474121094, | |
| "light": true, | |
| "lpg": 0.008895956948783413, | |
| "motion": false, | |
| "smoke": 0.023978358312270912, | |
| "temp": 31.799999237060547 | |
| }, | |
| "device_id": "6e:81:c9:d4:9e:58", | |
| "ts": 1594419195.292461 | |
| } |
As shown below, using tcpdump on the IoT device, the MQTT message payloads generated by the script average approximately 275 bytes. The complete MQTT messages average around 300 bytes.

AWS IoT Core
Each Raspberry Pi is registered with AWS IoT Core. IoT Core allows users to quickly and securely connect devices to AWS. According to AWS, IoT Core can reliably scale to billions of devices and trillions of messages. Registered devices are referred to as things in AWS IoT Core. A thing is a representation of a specific device or logical entity. Information about a thing is stored in the registry as JSON data.
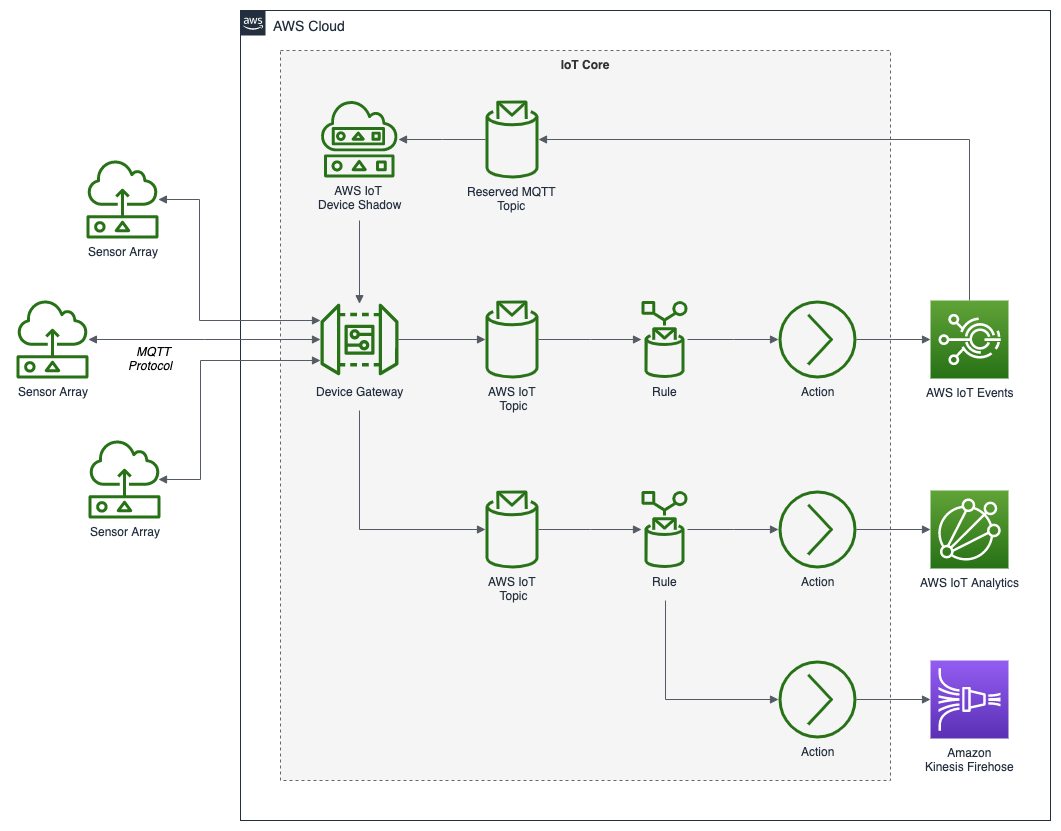
IoT Core provides a Device Gateway, which manages all active device connections. The Gateway currently supports MQTT, WebSockets, and HTTP 1.1 protocols. Behind the Message Gateway is a high-throughput pub/sub Message Broker, which securely transmits messages to and from all IoT devices and applications with low latency. Below, we see a typical AWS IoT Core architecture.
At a message frequency of five seconds, the three Raspberry Pi devices publish a total of roughly 50,000 IoT messages per day to AWS IoT Core.

AWS IoT Security
AWS IoT Core provides mutual authentication and encryption, ensuring all data is exchanged between AWS and the devices are secure by default. In the demo, all data is sent securely using Transport Layer Security (TLS) 1.2 with X.509 digital certificates on port 443. Authorization of the device to access any resource on AWS is controlled by individual AWS IoT Core Policies, similar to AWS IAM Policies. Below, we see an example of an X.509 certificate, assigned to a registered device.

AWS IoT Core Rules
Once an MQTT message is received from an IoT device (a thing), we use AWS IoT Rules to send message data to an AWS IoT Analytics Channel. Rules give your devices the ability to interact with AWS services. Rules are written in standard Structured Query Language (SQL). Rules are analyzed, and Actions are performed based on the MQTT topic stream. Below, we see an example rule that forwards our messages to IoT Analytics, in addition to AWS IoT Events and Amazon Kinesis Data Firehose.

Simulating IoT Device Messages
Building and configuring multiple Raspberry Pi-based sensor arrays, and registering the devices with AWS IoT Core would require a lot of work just for this post. Therefore, I have provided everything you need to simulate the three IoT devices, on GitHub. Use the following command to git clone a local copy of the project.
This file contains bidirectional Unicode text that may be interpreted or compiled differently than what appears below. To review, open the file in an editor that reveals hidden Unicode characters.
Learn more about bidirectional Unicode characters
| git clone \ | |
| –branch master –single-branch –depth 1 –no-tags \ | |
| https://github.com/garystafford/aws-iot-analytics-demo.git |
AWS CloudFormation
Use the CloudFormation template, iot-analytics.yaml, to create an IoT Analytics stack containing (17) resources, including the following.
- (3) AWS IoT Things
- (1) AWS IoT Core Topic Rule
- (1) AWS IoT Analytics Channel, Pipeline, Data store, and Data set
- (1) AWS Lambda and Lambda Permission
- (1) Amazon S3 Bucket
- (1) Amazon SageMaker Notebook Instance
- (5) AWS IAM Roles
Please be aware of the costs involved with the AWS resources used in the CloudFormation template before continuing. To build the AWS CloudFormation stack, run the following AWS CLI command.
This file contains bidirectional Unicode text that may be interpreted or compiled differently than what appears below. To review, open the file in an editor that reveals hidden Unicode characters.
Learn more about bidirectional Unicode characters
| aws cloudformation create-stack \ | |
| –stack-name iot-analytics-demo \ | |
| –template-body file://cloudformation/iot-analytics.yaml \ | |
| –parameters ParameterKey=ProjectName,ParameterValue=iot-analytics-demo \ | |
| ParameterKey=IoTTopicName,ParameterValue=iot-device-data \ | |
| –capabilities CAPABILITY_NAMED_IAM |
Below, we see a successful deployment of the IoT Analytics Demo CloudFormation Stack.

Publishing Sample Messages
Once the CloudFormation stack is created successfully, use an included Python script, send_sample_messages.py, to send sample IoT data to an AWS IoT Topic, from your local machine. The script will use your AWS identity and credentials, instead of an actual IoT device registered with IoT Core. The IoT data will be intercepted by an IoT Topic Rule and redirected, using a Topic Rule Action, to the IoT Analytics Channel.
First, we will ensure the IoT stack is running correctly on AWS by sending a few test messages. Go to the AWS IoT Core Test tab. Subscribe to the iot-device-data topic.

Then, run the following command using the smaller data file, raw_data_small.json.
This file contains bidirectional Unicode text that may be interpreted or compiled differently than what appears below. To review, open the file in an editor that reveals hidden Unicode characters.
Learn more about bidirectional Unicode characters
| cd sample_data/ | |
| time python3 ./send_sample_messages.py \ | |
| -f raw_data_small.json -t iot-device-data |
If successful, you should see the five messages appear in the Test tab, shown above. Example output from the script is shown below.

Then, run the second command using the larger data file, raw_data_large.json, containing 9,995 messages (a few hours worth of data). The command will take approximately 12 minutes to complete.
This file contains bidirectional Unicode text that may be interpreted or compiled differently than what appears below. To review, open the file in an editor that reveals hidden Unicode characters.
Learn more about bidirectional Unicode characters
| time python3 ./send_sample_messages.py \ | |
| -f raw_data_large.json -t iot-device-data |
Once the second command completes successfully, your IoT Analytics Channel should contain 10,000 unique messages. There is an optional extra-large data file containing approximately 50,000 IoT messages (24 hours of IoT messages).
AWS IoT Analytics
AWS IoT Analytics is composed of five primary components: Channels, Pipelines, Data stores, Data sets, and Notebooks. These components enable you to collect, prepare, store, analyze, and visualize your IoT data.

Below, we see a typical AWS IoT Analytics architecture. IoT messages are pulled from AWS IoT Core, thought a Rule Action. Amazon QuickSight provides business intelligence, visualization. Amazon QuickSight ML Insights adds anomaly detection and forecasting.

IoT Analytics Channel
An AWS IoT Analytics Channel pulls messages or data into IoT Analytics from other AWS sources, such as Amazon S3, Amazon Kinesis, or Amazon IoT Core. Channels store data for IoT Analytics Pipelines. Both Channels and Data store support storing data in your own Amazon S3 bucket or in an IoT Analytics service-managed S3 bucket. In the demonstration, we are using a service managed S3 bucket.
When creating a Channel, you also decide how long to retain the data. For the demonstration, we have set the data retention period for 14 days. Channels are generally not used for long term storage of data. Typically, you would only retain data in the Channel for the time period you need to analyze. For long term storage of IoT message data, I recommend using an AWS IoT Core Rule to send a copy of the raw IoT data to Amazon S3, using a service such as Amazon Kinesis Data Firehose.

IoT Analytics Pipeline
An AWS IoT Analytics Pipeline consumes messages from one or more Channels. Pipelines transform, filter, and enrich the messages before storing them in IoT Analytics Data stores. A Pipeline is composed of an array of activities. Logically, you must specify both a Channel (source) and a Datastore (destination) activity. Optionally, you may choose as many as 23 additional activities in the pipelineActivities array.
In our demonstration’s Pipeline, iot_analytics_pipeline, we have specified five additional activities, including DeviceRegistryEnrich, Filter, Math, Lambda, and SelectAttributes. There are two additional Activity types we did not choose, RemoveAttributes and AddAttributes.

The demonstration’s Pipeline created by CloudFormation starts with messages from the demonstration’s Channel, iot_analytics_channel, similar to the following.
This file contains bidirectional Unicode text that may be interpreted or compiled differently than what appears below. To review, open the file in an editor that reveals hidden Unicode characters.
Learn more about bidirectional Unicode characters
| { | |
| "co": 0.004782974313835918, | |
| "device_id": "ae:c4:1d:34:1c:7b", | |
| "device": "iot-device-01", | |
| "humidity": 68.81000305175781, | |
| "light": true, | |
| "lpg": 0.007456714657976871, | |
| "msg_received": "2020-07-13T19:44:58.690+0000", | |
| "motion": false, | |
| "smoke": 0.019858593777432054, | |
| "temp": 19.200000762939453, | |
| "ts": 1594496359.235107 | |
| } |
The demonstration’s Pipeline transforms the messages through a series of Pipeline Activities and then stores the resulting message in the demonstration’s Data store, iot_analytics_data_store. The resulting messages appear similar to the following.
This file contains bidirectional Unicode text that may be interpreted or compiled differently than what appears below. To review, open the file in an editor that reveals hidden Unicode characters.
Learn more about bidirectional Unicode characters
| { | |
| "co": 0.0048, | |
| "device": "iot-device-01", | |
| "humidity": 68.81, | |
| "light": true, | |
| "lpg": 0.0075, | |
| "metadata": "{defaultclientid=iot-device-01, thingname=iot-device-01, thingid=5de1c2af-14b4-49b5-b20b-b25cf251b01a, thingarn=arn:aws:iot:us-east-1:864887685992:thing/iot-device-01, thingtypename=null, attributes={installed=1594665292, latitude=37.4133144, longitude=-122.1513069}, version=2, billinggroupname=null}", | |
| "msg_received": "2020-07-13T19:44:58.690+0000", | |
| "motion": false, | |
| "smoke": 0.0199, | |
| "temp": 66.56, | |
| "ts": 1594496359.235107 | |
| } |
In our demonstration, transformations to the messages include dropping the device_id attribute and converting the temp attribute value to Fahrenheit. In addition, the Lambda Activity rounds down the temp, humidity, co, lpg, and smoke attribute values to between 2–4 decimal places of precision.

The demonstration’s Pipeline also enriches the message with the metadata attribute, containing metadata from the IoT device’s AWS IoT Core Registry. The metadata includes additional information about the device that generated the message, including custom attributes we input, such as location (longitude and latitude) and the device’s installation date.

A significant feature of Pipelines is the ability to reprocess messages. If you make a change to the Pipeline, which often happens during the data preparation stage, you can reprocess any or all messages in the associated Channel, and overwrite the messages in the Data set.

IoT Analytics Data store
An AWS IoT Analytics Data store stores prepared data from an AWS IoT Analytics Pipeline, in a fully-managed database. Both Channels and Data store support storing data in your own Amazon S3 bucket or in an IoT Analytics managed S3 bucket. In the demonstration, we are using a service-managed S3 bucket to store messages in our Data store.

IoT Analytics Data set
An AWS IoT Analytics Data set automatically provides regular, up-to-date insights for data analysts by querying a Data store using standard SQL. Regular updates are provided through the use of a cron expression. For the demonstration, we are using a 15-minute interval.
Below, we see the sample messages in the Result preview pane of the Data set. These are the five test messages we sent to check the stack. Note the SQL query used to obtain the messages, which queries the Data store. The Data store, as you will recall, contains the transformed messages from the Pipeline.

IoT Analytics Data sets also support sending content results, which are materialized views of your IoT Analytics data, to an Amazon S3 bucket.

The CloudFormation stack contains an encrypted Amazon S3 Bucket. This bucket receives a copy of the messages from the IoT Analytics Data set whenever the scheduled update is run by the cron expression.

IoT Analytics Notebook
An AWS IoT Analytics Notebook allows users to perform statistical analysis and machine learning on IoT Analytics Data sets using Jupyter Notebooks. The IoT Analytics Notebook service includes a set of notebook templates that contain AWS-authored machine learning models and visualizations. Notebooks Instances can be linked to a GitHub or other source code repository. Notebooks created with IoT Analytics Notebook can also be accessed directly through Amazon SageMaker. For the demonstration, the Notebooks Instance is associated with the project’s GitHub repository.

The repository contains a sample Jupyter Notebook, IoT_Analytics_Demo_Notebook.ipynb, based on the conda_python3 kernel. This preinstalled environment includes the default Anaconda installation and Python 3. The Notebook uses pandas, matplotlib, and plotly to manipulate and visualize the sample IoT messages we published earlier and stored in the Data set.


Notebooks can be modified, and the changes pushed back to GitHub. You could easily fork a copy of my GitHub repository and modify the CloudFormation template, to include your own GitHub repository URL.

Amazon QuickSight
Amazon QuickSight provides business intelligence (BI) and visualization. Amazon QuickSight ML Insights adds anomaly detection and forecasting. We can use Amazon QuickSight to visualize the IoT message data, stored in the IoT Analytics Data set.
Amazon QuickSight has both a Standard and an Enterprise Edition. AWS provides a detailed product comparison of each edition. For the post, I am demonstrating the Enterprise Edition, which includes additional features, such as ML Insights, hourly refreshes of SPICE (super-fast, parallel, in-memory, calculation engine), and theme customization. Please be aware of the costs of Amazon QuickSight if you choose to follow along with this part of the demo. Amazon QuickSight is enabled or configured with the demonstration’s CloudFormation template.
QuickSight Data Sets
Amazon QuickSight has a wide variety of data source options for creating Amazon QuickSight Data sets, including the ones shown below. Do not confuse Amazon QuickSight Data sets with IoT Analytics Data sets. These are two different, yet similar, constructs.

For the demonstration, we will create an Amazon QuickSight Data set that will use our IoT Analytics Data set as a data source.

Amazon QuickSight gives you the ability to modify QuickSight Data sets. For the demonstration, I have added two additional fields, converting the boolean light and motion values of true and false to binary values of 0 or 1. I have also deselected two fields that I do not need for QuickSight Analysis.

QuickSight provides a wide variety of functions, enabling us to perform dynamic calculations on the field values. Below, we see a new calculated field, light_dec, containing the original light field’s Boolean values converted to binary values. I am using a if...else formula to change the field’s value depending on the value in another field.

QuickSight Analysis
Using the QuickSight Data set, built from the IoT Analytics Data set as a data source, we create a QuickSight Analysis. The QuickSight Analysis user interface is shown below. An Analysis is primarily a collection of Visuals (Visual types). QuickSight provides a number of Visual types. Each visual is associated with a Data set. Data for the QuickSight Analysis or for each individual visual can be filtered. For the demo, I have created a QuickSight Analysis, including several typical QuickSight Visuals.

QuickSight Dashboards
To share a QuickSight Analysis, we can create a QuickSight Dashboard. Below, we see a few views of the QuickSight Analysis, shown above, as a Dashboard. A viewer of the Dashboard cannot edit the visuals, though they can apply filtering and interactively drill-down into data in the Visuals.


Geospatial Data
Amazon QuickSight understands geospatial data. If you recall, in the IoT Analytics Pipeline, we enriched the messages in the metadata from the device registry. The metadata attributes contained the device’s longitude and latitude. Quicksight will recognize those fields as geographic fields. In our QuickSight Analysis, we can visualize the geospatial data, using the geospatial chart (map) Visual type.

QuickSight Mobile App
Amazon QuickSight offers free iOS and Android versions of the Amazon QuickSight Mobile App. The mobile application makes it easy for registered QuickSight end-users to securely connect to QuickSight Dashboards, using their mobile devices. Below, we see two views of the same Dashboard, shown in the iOS version of the Amazon QuickSight Mobile App.

Amazon QuickSight ML Insights
According to Amazon, ML Insights leverages AWS’s machine learning (ML) and natural language capabilities to gain deeper insights from data. QuickSight’s ML-powered Anomaly Detection continuously analyze data to discover anomalies and variations inside of the aggregates, giving you the insights to act when business changes occur. QuickSight’s ML-powered Forecasting can be used to accurately predict your business metrics, and perform interactive what-if analysis with point-and-click simplicity. QuickSight’s built-in algorithms make it easy for anyone to use ML that learns from your data patterns to provide you with accurate predictions based on historical trends.
Below, we see the ML Insights tab in the demonstration’s QuickSight Analysis. Individually detected anomalies can be added to the QuickSight Analysis, similar to Visuals, and configured to tune the detection parameters.

Below, we see an example of humidity anomalies across all devices, based on their Anomaly Score and are higher or lower with a minimum delta of five percent.

Cleaning Up
You are charged hourly for the SageMaker Notebook Instance. Do not forget to delete your CloudFormation stack when you are done with the demonstration. Note the Amazon S3 bucket will not be deleted; you must do this manually.
This file contains bidirectional Unicode text that may be interpreted or compiled differently than what appears below. To review, open the file in an editor that reveals hidden Unicode characters.
Learn more about bidirectional Unicode characters
| aws cloudformation delete-stack \ | |
| –stack-name iot-analytics-demo |
Conclusion
In this post, we demonstrated how to use AWS IoT Analytics to analyze and visualize streaming messages from multiple IoT devices, in near real-time. Combined with other AWS IoT analytics services, such as AWS IoT SiteWise, AWS IoT Events, and AWS IoT Things Graph, you can create a robust, full-featured IoT Analytics platform, capable of handling millions of industrial, commercial, and residential IoT devices, generating petabytes of data.
This blog represents my own viewpoints and not of my employer, Amazon Web Services.
