Posts Tagged Zipkin
Kubernetes-based Microservice Observability with Istio Service Mesh on Google Kubernetes Engine (GKE): Part 1
Posted by Gary A. Stafford in Build Automation, Client-Side Development, Cloud, DevOps, GCP, Go, JavaScript, Kubernetes, Software Development on March 10, 2019
In this two-part post, we will explore the set of observability tools which are part of the Istio Service Mesh. These tools include Jaeger, Kiali, Prometheus, and Grafana. To assist in our exploration, we will deploy a Go-based, microservices reference platform to Google Kubernetes Engine, on the Google Cloud Platform.

What is Observability?
Similar to blockchain, serverless, AI and ML, chatbots, cybersecurity, and service meshes, Observability is a hot buzz word in the IT industry right now. According to Wikipedia, observability is a measure of how well internal states of a system can be inferred from knowledge of its external outputs. Logs, metrics, and traces are often known as the three pillars of observability. These are the external outputs of the system, which we may observe.
The O’Reilly book, Distributed Systems Observability, by Cindy Sridharan, does an excellent job of detailing ‘The Three Pillars of Observability’, in Chapter 4. I recommend reading this free online excerpt, before continuing. A second great resource for information on observability is honeycomb.io, a developer of observability tools for production systems, led by well-known industry thought-leader, Charity Majors. The honeycomb.io site includes articles, blog posts, whitepapers, and podcasts on observability.
As modern distributed systems grow ever more complex, the ability to observe those systems demands equally modern tooling that was designed with this level of complexity in mind. Traditional logging and monitoring systems often struggle with today’s hybrid and multi-cloud, polyglot language-based, event-driven, container-based and serverless, infinitely-scalable, ephemeral-compute platforms.
Tools like Istio Service Mesh attempt to solve the observability challenge by offering native integrations with several best-of-breed, open-source telemetry tools. Istio’s integrations include Jaeger for distributed tracing, Kiali for Istio service mesh-based microservice visualization, and Prometheus and Grafana for metric collection, monitoring, and alerting. Combined with cloud platform-native monitoring and logging services, such as Stackdriver for Google Kubernetes Engine (GKE) on Google Cloud Platform (GCP), we have a complete observability platform for modern, distributed applications.
A Reference Microservices Platform
To demonstrate the observability tools integrated with the latest version of Istio Service Mesh, we will deploy a reference microservices platform, written in Go, to GKE on GCP. I developed the reference platform to demonstrate concepts such as API management, Service Meshes, Observability, DevOps, and Chaos Engineering. The platform is comprised of (14) components, including (8) Go-based microservices, labeled generically as Service A – Service H, (1) Angular 7, TypeScript-based front-end, (4) MongoDB databases, and (1) RabbitMQ queue for event queue-based communications. The platform and all its source code is free and open source.
The reference platform is designed to generate HTTP-based service-to-service, TCP-based service-to-database (MongoDB), and TCP-based service-to-queue-to-service (RabbitMQ) IPC (inter-process communication). Service A calls Service B and Service C, Service B calls Service D and Service E, Service D produces a message on a RabbitMQ queue that Service F consumes and writes to MongoDB, and so on. These distributed communications can be observed using Istio’s observability tools when the system is deployed to a Kubernetes cluster running the Istio service mesh.
Service Responses
On the reference platform, each upstream service responds to requests from downstream services by returning a small informational JSON payload (termed a greeting in the source code).

The responses are aggregated across the service call chain, resulting in an array of service responses being returned to the edge service and on to the Angular-based UI, running in the end user’s web browser. The response aggregation feature is simply used to confirm that the service-to-service communications, Istio components, and the telemetry tools are working properly.

Each Go microservice contains a /ping and /health endpoint. The /health endpoint can be used to configure Kubernetes Liveness and Readiness Probes. Additionally, the edge service, Service A, is configured for Cross-Origin Resource Sharing (CORS) using the access-control-allow-origin: * response header. CORS allows the Angular UI, running in end user’s web browser, to call the Service A /ping endpoint, which resides in a different subdomain from UI. Shown below is the Go source code for Service A.
This file contains bidirectional Unicode text that may be interpreted or compiled differently than what appears below. To review, open the file in an editor that reveals hidden Unicode characters.
Learn more about bidirectional Unicode characters
| // author: Gary A. Stafford | |
| // site: https://programmaticponderings.com | |
| // license: MIT License | |
| // purpose: Service A | |
| package main | |
| import ( | |
| "encoding/json" | |
| "github.com/banzaicloud/logrus-runtime-formatter" | |
| "github.com/google/uuid" | |
| "github.com/gorilla/mux" | |
| "github.com/prometheus/client_golang/prometheus/promhttp" | |
| "github.com/rs/cors" | |
| log "github.com/sirupsen/logrus" | |
| "io/ioutil" | |
| "net/http" | |
| "os" | |
| "strconv" | |
| "time" | |
| ) | |
| type Greeting struct { | |
| ID string `json:"id,omitempty"` | |
| ServiceName string `json:"service,omitempty"` | |
| Message string `json:"message,omitempty"` | |
| CreatedAt time.Time `json:"created,omitempty"` | |
| } | |
| var greetings []Greeting | |
| func PingHandler(w http.ResponseWriter, r *http.Request) { | |
| w.Header().Set("Content-Type", "application/json; charset=utf-8") | |
| log.Debug(r) | |
| greetings = nil | |
| CallNextServiceWithTrace("http://service-b/api/ping", w, r) | |
| CallNextServiceWithTrace("http://service-c/api/ping", w, r) | |
| tmpGreeting := Greeting{ | |
| ID: uuid.New().String(), | |
| ServiceName: "Service-A", | |
| Message: "Hello, from Service-A!", | |
| CreatedAt: time.Now().Local(), | |
| } | |
| greetings = append(greetings, tmpGreeting) | |
| err := json.NewEncoder(w).Encode(greetings) | |
| if err != nil { | |
| log.Error(err) | |
| } | |
| } | |
| func HealthCheckHandler(w http.ResponseWriter, r *http.Request) { | |
| w.Header().Set("Content-Type", "application/json; charset=utf-8") | |
| _, err := w.Write([]byte("{\"alive\": true}")) | |
| if err != nil { | |
| log.Error(err) | |
| } | |
| } | |
| func ResponseStatusHandler(w http.ResponseWriter, r *http.Request) { | |
| params := mux.Vars(r) | |
| statusCode, err := strconv.Atoi(params["code"]) | |
| if err != nil { | |
| log.Error(err) | |
| } | |
| w.WriteHeader(statusCode) | |
| } | |
| func CallNextServiceWithTrace(url string, w http.ResponseWriter, r *http.Request) { | |
| var tmpGreetings []Greeting | |
| w.Header().Set("Content-Type", "application/json; charset=utf-8") | |
| req, err := http.NewRequest("GET", url, nil) | |
| if err != nil { | |
| log.Error(err) | |
| } | |
| // Headers must be passed for Jaeger Distributed Tracing | |
| headers := []string{ | |
| "x-request-id", | |
| "x-b3-traceid", | |
| "x-b3-spanid", | |
| "x-b3-parentspanid", | |
| "x-b3-sampled", | |
| "x-b3-flags", | |
| "x-ot-span-context", | |
| } | |
| for _, header := range headers { | |
| if r.Header.Get(header) != "" { | |
| req.Header.Add(header, r.Header.Get(header)) | |
| } | |
| } | |
| log.Info(req) | |
| client := &http.Client{} | |
| response, err := client.Do(req) | |
| if err != nil { | |
| log.Error(err) | |
| } | |
| defer response.Body.Close() | |
| body, err := ioutil.ReadAll(response.Body) | |
| if err != nil { | |
| log.Error(err) | |
| } | |
| err = json.Unmarshal(body, &tmpGreetings) | |
| if err != nil { | |
| log.Error(err) | |
| } | |
| for _, r := range tmpGreetings { | |
| greetings = append(greetings, r) | |
| } | |
| } | |
| func getEnv(key, fallback string) string { | |
| if value, ok := os.LookupEnv(key); ok { | |
| return value | |
| } | |
| return fallback | |
| } | |
| func init() { | |
| formatter := runtime.Formatter{ChildFormatter: &log.JSONFormatter{}} | |
| formatter.Line = true | |
| log.SetFormatter(&formatter) | |
| log.SetOutput(os.Stdout) | |
| level, err := log.ParseLevel(getEnv("LOG_LEVEL", "info")) | |
| if err != nil { | |
| log.Error(err) | |
| } | |
| log.SetLevel(level) | |
| } | |
| func main() { | |
| c := cors.New(cors.Options{ | |
| AllowedOrigins: []string{"*"}, | |
| AllowCredentials: true, | |
| AllowedMethods: []string{"GET", "POST", "PATCH", "PUT", "DELETE", "OPTIONS"}, | |
| }) | |
| router := mux.NewRouter() | |
| api := router.PathPrefix("/api").Subrouter() | |
| api.HandleFunc("/ping", PingHandler).Methods("GET", "OPTIONS") | |
| api.HandleFunc("/health", HealthCheckHandler).Methods("GET", "OPTIONS") | |
| api.HandleFunc("/status/{code}", ResponseStatusHandler).Methods("GET", "OPTIONS") | |
| api.Handle("/metrics", promhttp.Handler()) | |
| handler := c.Handler(router) | |
| log.Fatal(http.ListenAndServe(":80", handler)) | |
| } |
For this demonstration, the MongoDB databases will be hosted, external to the services on GCP, on MongoDB Atlas, a MongoDB-as-a-Service, cloud-based platform. Similarly, the RabbitMQ queues will be hosted on CloudAMQP, a RabbitMQ-as-a-Service, cloud-based platform. I have used both of these SaaS providers in several previous posts. Using external services will help us understand how Istio and its observability tools collect telemetry for communications between the Kubernetes cluster and external systems.
Shown below is the Go source code for Service F, This service consumers messages from the RabbitMQ queue, placed there by Service D, and writes the messages to MongoDB.
This file contains bidirectional Unicode text that may be interpreted or compiled differently than what appears below. To review, open the file in an editor that reveals hidden Unicode characters.
Learn more about bidirectional Unicode characters
| // author: Gary A. Stafford | |
| // site: https://programmaticponderings.com | |
| // license: MIT License | |
| // purpose: Service F | |
| package main | |
| import ( | |
| "bytes" | |
| "context" | |
| "encoding/json" | |
| "github.com/banzaicloud/logrus-runtime-formatter" | |
| "github.com/google/uuid" | |
| "github.com/gorilla/mux" | |
| log "github.com/sirupsen/logrus" | |
| "github.com/streadway/amqp" | |
| "go.mongodb.org/mongo-driver/mongo" | |
| "go.mongodb.org/mongo-driver/mongo/options" | |
| "net/http" | |
| "os" | |
| "time" | |
| ) | |
| type Greeting struct { | |
| ID string `json:"id,omitempty"` | |
| ServiceName string `json:"service,omitempty"` | |
| Message string `json:"message,omitempty"` | |
| CreatedAt time.Time `json:"created,omitempty"` | |
| } | |
| var greetings []Greeting | |
| func PingHandler(w http.ResponseWriter, r *http.Request) { | |
| w.Header().Set("Content-Type", "application/json; charset=utf-8") | |
| greetings = nil | |
| tmpGreeting := Greeting{ | |
| ID: uuid.New().String(), | |
| ServiceName: "Service-F", | |
| Message: "Hola, from Service-F!", | |
| CreatedAt: time.Now().Local(), | |
| } | |
| greetings = append(greetings, tmpGreeting) | |
| CallMongoDB(tmpGreeting) | |
| err := json.NewEncoder(w).Encode(greetings) | |
| if err != nil { | |
| log.Error(err) | |
| } | |
| } | |
| func HealthCheckHandler(w http.ResponseWriter, r *http.Request) { | |
| w.Header().Set("Content-Type", "application/json; charset=utf-8") | |
| _, err := w.Write([]byte("{\"alive\": true}")) | |
| if err != nil { | |
| log.Error(err) | |
| } | |
| } | |
| func CallMongoDB(greeting Greeting) { | |
| log.Info(greeting) | |
| ctx, _ := context.WithTimeout(context.Background(), 10*time.Second) | |
| client, err := mongo.Connect(ctx, options.Client().ApplyURI(os.Getenv("MONGO_CONN"))) | |
| if err != nil { | |
| log.Error(err) | |
| } | |
| defer client.Disconnect(nil) | |
| collection := client.Database("service-f").Collection("messages") | |
| ctx, _ = context.WithTimeout(context.Background(), 5*time.Second) | |
| _, err = collection.InsertOne(ctx, greeting) | |
| if err != nil { | |
| log.Error(err) | |
| } | |
| } | |
| func GetMessages() { | |
| conn, err := amqp.Dial(os.Getenv("RABBITMQ_CONN")) | |
| if err != nil { | |
| log.Error(err) | |
| } | |
| defer conn.Close() | |
| ch, err := conn.Channel() | |
| if err != nil { | |
| log.Error(err) | |
| } | |
| defer ch.Close() | |
| q, err := ch.QueueDeclare( | |
| "service-d", | |
| false, | |
| false, | |
| false, | |
| false, | |
| nil, | |
| ) | |
| if err != nil { | |
| log.Error(err) | |
| } | |
| msgs, err := ch.Consume( | |
| q.Name, | |
| "service-f", | |
| true, | |
| false, | |
| false, | |
| false, | |
| nil, | |
| ) | |
| if err != nil { | |
| log.Error(err) | |
| } | |
| forever := make(chan bool) | |
| go func() { | |
| for delivery := range msgs { | |
| log.Debug(delivery) | |
| CallMongoDB(deserialize(delivery.Body)) | |
| } | |
| }() | |
| <-forever | |
| } | |
| func deserialize(b []byte) (t Greeting) { | |
| log.Debug(b) | |
| var tmpGreeting Greeting | |
| buf := bytes.NewBuffer(b) | |
| decoder := json.NewDecoder(buf) | |
| err := decoder.Decode(&tmpGreeting) | |
| if err != nil { | |
| log.Error(err) | |
| } | |
| return tmpGreeting | |
| } | |
| func getEnv(key, fallback string) string { | |
| if value, ok := os.LookupEnv(key); ok { | |
| return value | |
| } | |
| return fallback | |
| } | |
| func init() { | |
| formatter := runtime.Formatter{ChildFormatter: &log.JSONFormatter{}} | |
| formatter.Line = true | |
| log.SetFormatter(&formatter) | |
| log.SetOutput(os.Stdout) | |
| level, err := log.ParseLevel(getEnv("LOG_LEVEL", "info")) | |
| if err != nil { | |
| log.Error(err) | |
| } | |
| log.SetLevel(level) | |
| } | |
| func main() { | |
| go GetMessages() | |
| router := mux.NewRouter() | |
| api := router.PathPrefix("/api").Subrouter() | |
| api.HandleFunc("/ping", PingHandler).Methods("GET") | |
| api.HandleFunc("/health", HealthCheckHandler).Methods("GET") | |
| log.Fatal(http.ListenAndServe(":80", router)) | |
| } |
Source Code
All source code for this post is available on GitHub in two projects. The Go-based microservices source code, all Kubernetes resources, and all deployment scripts are located in the k8s-istio-observe-backend project repository. The Angular UI TypeScript-based source code is located in the k8s-istio-observe-frontend project repository. You should not need to clone the Angular UI project for this demonstration.
git clone --branch master --single-branch --depth 1 --no-tags \
  https://github.com/garystafford/k8s-istio-observe-backend.git
Docker images referenced in the Kubernetes Deployment resource files, for the Go services and UI, are all available on Docker Hub. The Go microservice Docker images were built using the official Golang Alpine base image on DockerHub, containing Go version 1.12.0. Using the Alpine image to compile the Go source code ensures the containers will be as small as possible and contain a minimal attack surface.
System Requirements
To follow along with the post, you will need the latest version of gcloud CLI (min. ver. 239.0.0), part of the Google Cloud SDK, Helm, and the just releases Istio 1.1.0, installed and configured locally or on your build machine.

Set-up and Installation
To deploy the microservices platform to GKE, we will proceed in the following order.
- Create the MongoDB Atlas database cluster;
- Create the CloudAMQP RabbitMQ cluster;
- Modify the Kubernetes resources and scripts for your own environments;
- Create the GKE cluster on GCP;
- Deploy Istio 1.1.0 to the GKE cluster, using Helm;
- Create DNS records for the platform’s exposed resources;
- Deploy the Go-based microservices, Angular UI, and associated resources to GKE;
- Test and troubleshoot the platform;
- Observe the results in part two!
MongoDB Atlas Cluster
MongoDB Atlas is a fully-managed MongoDB-as-a-Service, available on AWS, Azure, and GCP. Atlas, a mature SaaS product, offers high-availability, guaranteed uptime SLAs, elastic scalability, cross-region replication, enterprise-grade security, LDAP integration, a BI Connector, and much more.
MongoDB Atlas currently offers four pricing plans, Free, Basic, Pro, and Enterprise. Plans range from the smallest, M0-sized MongoDB cluster, with shared RAM and 512 MB storage, up to the massive M400 MongoDB cluster, with 488 GB of RAM and 3 TB of storage.
For this post, I have created an M2-sized MongoDB cluster in GCP’s us-central1 (Iowa) region, with a single user database account for this demo. The account will be used to connect from four of the eight microservices, running on GKE.

Originally, I started with an M0-sized cluster, but the compute resources were insufficient to support the volume of calls from the Go-based microservices. I suggest at least an M2-sized cluster or larger.
CloudAMQP RabbitMQ Cluster
CloudAMQP provides full-managed RabbitMQ clusters on all major cloud and application platforms. RabbitMQ will support a decoupled, eventually consistent, message-based architecture for a portion of our Go-based microservices. For this post, I have created a RabbitMQ cluster in GCP’s us-central1 (Iowa) region, the same as our GKE cluster and MongoDB Atlas cluster. I chose a minimally-configured free version of RabbitMQ. CloudAMQP also offers robust, multi-node RabbitMQ clusters for Production use.
Modify Configurations
There are a few configuration settings you will need to change in the GitHub project’s Kubernetes resource files and Bash deployment scripts.
Istio ServiceEntry for MongoDB Atlas
Modify the Istio ServiceEntry, external-mesh-mongodb-atlas.yaml file, adding you MongoDB Atlas host address. This file allows egress traffic from four of the microservices on GKE to the external MongoDB Atlas cluster.
apiVersion: networking.istio.io/v1alpha3
kind: ServiceEntry
metadata:
  name: mongodb-atlas-external-mesh
spec:
  hosts:
  - {{ your_host_goes_here }}
  ports:
  - name: mongo
    number: 27017
    protocol: MONGO
  location: MESH_EXTERNAL
  resolution: NONE
Istio ServiceEntry for CloudAMQP RabbitMQ
Modify the Istio ServiceEntry, external-mesh-cloudamqp.yaml file, adding you CloudAMQP host address. This file allows egress traffic from two of the microservices to the CloudAMQP cluster.
apiVersion: networking.istio.io/v1alpha3
kind: ServiceEntry
metadata:
  name: cloudamqp-external-mesh
spec:
  hosts:
  - {{ your_host_goes_here }}
  ports:
  - name: rabbitmq
    number: 5672
    protocol: TCP
  location: MESH_EXTERNAL
  resolution: NONE
Istio Gateway and VirtualService Resources
There are numerous strategies you may use to route traffic into the GKE cluster, via Istio. I am using a single domain for the post, example-api.com, and four subdomains. One set of subdomains is for the Angular UI, in the dev Namespace (ui.dev.example-api.com) and the test Namespace (ui.test.example-api.com). The other set of subdomains is for the edge API microservice, Service A, which the UI calls (api.dev.example-api.com and api.test.example-api.com). Traffic is routed to specific Kubernetes Service resources, based on the URL.
According to Istio, the Gateway describes a load balancer operating at the edge of the mesh, receiving incoming or outgoing HTTP/TCP connections. Modify the Istio ingress Gateway, inserting your own domains or subdomains in the hosts section. These are the hosts on port 80 that will be allowed into the mesh.
apiVersion: networking.istio.io/v1alpha3
kind: Gateway
metadata:
  name: demo-gateway
spec:
  selector:
    istio: ingressgateway
  servers:
  - port:
      number: 80
      name: http
      protocol: HTTP
    hosts:
    - ui.dev.example-api.com
    - ui.test.example-api.com
    - api.dev.example-api.com
    - api.test.example-api.com
According to Istio, a VirtualService defines a set of traffic routing rules to apply when a host is addressed. A VirtualService is bound to a Gateway to control the forwarding of traffic arriving at a particular host and port. Modify the project’s four Istio VirtualServices, inserting your own domains or subdomains. Here is an example of one of the four VirtualServices, in the istio-gateway.yaml file.
apiVersion: networking.istio.io/v1alpha3
kind: VirtualService
metadata:
  name: angular-ui-dev
spec:
  hosts:
  - ui.dev.example-api.com
  gateways:
  - demo-gateway
  http:
  - match:
    - uri:
        prefix: /
    route:
    - destination:
        port:
          number: 80
        host: angular-ui.dev.svc.cluster.local
Kubernetes Secret
The project contains a Kubernetes Secret, go-srv-demo.yaml, with two values. One is for the MongoDB Atlas connection string and one is for the CloudAMQP connections string. Remember Kubernetes Secret values need to be base64 encoded.
apiVersion: v1
kind: Secret
metadata:
  name: go-srv-config
type: Opaque
data:
  mongodb.conn: {{ your_base64_encoded_secret }}
  rabbitmq.conn: {{ your_base64_encoded_secret }}
On Linux and Mac, you can use the base64 program to encode the connection strings.
> echo -n "mongodb+srv://username:password@atlas-cluster.gcp.mongodb.net/test?retryWrites=true" | base64
bW9uZ29kYitzcnY6Ly91c2VybmFtZTpwYXNzd29yZEBhdGxhcy1jbHVzdGVyLmdjcC5tb25nb2RiLm5ldC90ZXN0P3JldHJ5V3JpdGVzPXRydWU=

> echo -n "amqp://username:password@rmq.cloudamqp.com/cluster" | base64
YW1xcDovL3VzZXJuYW1lOnBhc3N3b3JkQHJtcS5jbG91ZGFtcXAuY29tL2NsdXN0ZXI=
Bash Scripts Variables
The bash script, part3_create_gke_cluster.sh, contains a series of environment variables. At a minimum, you will need to change the PROJECT variable in all scripts to match your GCP project name.
# Constants - CHANGE ME!
readonly PROJECT='{{ your_gcp_project_goes_here }}'
readonly CLUSTER='go-srv-demo-cluster'
readonly REGION='us-central1'
readonly MASTER_AUTH_NETS='72.231.208.0/24'
readonly GKE_VERSION='1.12.5-gke.5'
readonly MACHINE_TYPE='n1-standard-2'
The bash script, part4_install_istio.sh, includes the ISTIO_HOME variable. The value should correspond to your local path to Istio 1.1.0. On my local Mac, this value is shown below.
readonly ISTIO_HOME='/Applications/istio-1.1.0'
Deploy GKE Cluster
Next, deploy the GKE cluster using the included bash script, part3_create_gke_cluster.sh. This will create a Regional, multi-zone, 3-node GKE cluster, using the latest version of GKE at the time of this post, 1.12.5-gke.5. The cluster will be deployed to the same region as the MongoDB Atlas and CloudAMQP clusters, GCP’s us-central1 (Iowa) region. Planning where your Cloud resources will reside, for both SaaS providers and primary Cloud providers can be critical to minimizing latency for network I/O intensive applications.

Deploy Istio using Helm
With the GKE cluster and associated infrastructure in place, deploy Istio. For this post, I have chosen to install Istio using Helm, as recommended my Istio. To deploy Istio using Helm, use the included bash script, part4_install_istio.sh.

The script installs Istio, using the Helm Chart in the local Istio 1.1.0 install/kubernetes/helm/istio directory, which you installed as a requirement for this demonstration. The Istio install script overrides several default values in the Istio Helm Chart using the --set, flag. The list of available configuration values is detailed in the Istio Chart’s GitHub project. The options enable Istio’s observability features, which we will explore in part two. Features include Kiali, Grafana, Prometheus, and Jaeger.
helm install ${ISTIO_HOME}/install/kubernetes/helm/istio-init \
  --name istio-init \
  --namespace istio-system

helm install ${ISTIO_HOME}/install/kubernetes/helm/istio \
  --name istio \
  --namespace istio-system \
  --set prometheus.enabled=true \
  --set grafana.enabled=true \
  --set kiali.enabled=true \
  --set tracing.enabled=true

kubectl apply --namespace istio-system \
  -f ./resources/secrets/kiali.yaml
Below, we see the Istio-related Workloads running on the cluster, including the observability tools.

Below, we see the corresponding Istio-related Service resources running on the cluster.

Modify DNS Records
Instead of using IP addresses to route traffic the GKE cluster and its applications, we will use DNS. As explained earlier, I have chosen a single domain for the post, example-api.com, and four subdomains. One set of subdomains is for the Angular UI, in the dev Namespace and the test Namespace. The other set of subdomains is for the edge microservice, Service A, which the API calls. Traffic is routed to specific Kubernetes Service resources, based on the URL.
Deploying the GKE cluster and Istio triggers the creation of a Google Load Balancer, four IP addresses, and all required firewall rules. One of the four IP addresses, the one shown below, associated with the Forwarding rule, will be associated with the front-end of the load balancer.
Below, we see the new load balancer, with the front-end IP address and the backend VM pool of three GKE cluster’s worker nodes. Each node is assigned one of the IP addresses, as shown above.

As shown below, using Google Cloud DNS, I have created the four subdomains and assigned the IP address of the load balancer’s front-end to all four subdomains. Ingress traffic to these addresses will be routed through the Istio ingress Gateway and the four Istio VirtualServices, to the appropriate Kubernetes Service resources. Use your choice of DNS management tools to create the four A Type DNS records.

Deploy the Reference Platform
Next, deploy the eight Go-based microservices, the Angular UI, and the associated Kubernetes and Istio resources to the GKE cluster. To deploy the platform, use the included bash deploy script, part5a_deploy_resources.sh. If anything fails and you want to remove the existing resources and re-deploy, without destroying the GKE cluster or Istio, you can use the part5b_delete_resources.sh delete script.

The deploy script deploys all the resources two Kubernetes Namespaces, dev and test. This will allow us to see how we can differentiate between Namespaces when using the observability tools.
Below, we see the Istio-related resources, which we just deployed. They include the Istio Gateway, four Istio VirtualService, and two Istio ServiceEntry resources.

Below, we see the platform’s Workloads (Kubernetes Deployment resources), running on the cluster. Here we see two Pods for each Workload, a total of 18 Pods, running in the dev Namespace. Each Pod contains both the deployed microservice or UI component, as well as a copy of Istio’s Envoy Proxy.

Below, we see the corresponding Kubernetes Service resources running in the dev Namespace.

Below, a similar view of the Deployment resources running in the test Namespace. Again, we have two Pods for each deployment with each Pod contains both the deployed microservice or UI component, as well as a copy of Istio’s Envoy Proxy.

Test the Platform
We do want to ensure the platform’s eight Go-based microservices and Angular UI are working properly, communicating with each other, and communicating with the external MongoDB Atlas and CloudAMQP RabbitMQ clusters. The easiest way to test the cluster is by viewing the Angular UI in a web browser.
The UI requires you to input the host domain of the Service A, the API’s edge service. Since you cannot use my subdomain, and the JavaScript code is running locally to your web browser, this option allows you to provide your own host domain. This is the same domain or domains you inserted into the two Istio VirtualService for the UI. This domain route your API calls to either the FQDN (fully qualified domain name) of the Service A Kubernetes Service running in the dev namespace, service-a.dev.svc.cluster.local, or the test Namespace, service-a.test.svc.cluster.local.

You can also use performance testing tools to load-test the platform. Many issues will not show up until the platform is under load. I recently starting using hey, a modern load generator tool, as a replacement for Apache Bench (ab), Unlike ab, hey supports HTTP/2 endpoints, which is required to test the platform on GKE with Istio. Below, I am running hey directly from Google Cloud Shell. The tool is simulating 25 concurrent users, generating a total of 1,000 HTTP/2-based GET requests to Service A.

Troubleshooting
If for some reason the UI fails to display, or the call from the UI to the API fails, and assuming all Kubernetes and Istio resources are running on the GKE cluster (all green), the most common explanation is usually a misconfiguration of the following resources:
- Your four Cloud DNS records are not correct. They are not pointing to the load balancer’s front-end IP address;
- You did not configure the four Kubernetes
VirtualServiceresources with the correct subdomains; - The GKE-based microservices cannot reach the external MongoDB Atlas and CloudAMQP RabbitMQ clusters. Likely, the Kubernetes
Secretis constructed incorrectly, or the twoServiceEntryresources contain the wrong host information for those external clusters;
I suggest starting the troubleshooting by calling Service A, the API’s edge service, directly, using cURL or Postman. You should see a JSON response payload, similar to the following. This suggests the issue is with the UI, not the API.

Next, confirm that the four MongoDB databases were created for Service D, Service, F, Service, G, and Service H. Also, confirm that new documents are being written to the database’s collections.

Next, confirm new the RabbitMQ queue was created, using the CloudAMQP RabbitMQ Management Console. Service D produces messages, which Service F consumes from the queue.

Lastly, review the Stackdriver logs to see if there are any obvious errors.

Part Two
In part two of this post, we will explore each observability tool, and see how they can help us manage our GKE cluster and the reference platform running in the cluster.

Since the cluster only takes minutes to fully create and deploy resources to, if you want to tear down the GKE cluster, run the part6_tear_down.sh script.

All opinions expressed in this post are my own and not necessarily the views of my current or past employers or their clients.
Diving Deeper into ‘Getting Started with Spring Cloud’
Posted by Gary A. Stafford in DevOps, Enterprise Software Development, Java Development, Software Development on February 15, 2016

Explore the integration of Spring Cloud and Spring Cloud Netflix tooling, through a deep dive into Pivotal’s ‘Getting Started with Spring Cloud’ presentation.
Introduction
Keeping current with software development and DevOps trends can often make us feel we are, as the overused analogy describes, drinking from a firehose, often several hoses at once. Recently joining a large client engagement, I found it necessary to supplement my knowledge of cloud-native solutions, built with the support of Spring Cloud and Spring Cloud Netflix technologies. One of my favorite sources of information on these subjects is presentations by people like Josh Long, Dr. Dave Syer, and Cornelia Davis of Pivotal Labs, and Jon Schneider and Taylor Wicksell of Netflix.
One presentation, in particular, Getting Started with Spring Cloud, by Long and Syer, provides an excellent end-to-end technical overview of the latest Spring and Netflix technologies. Josh Long’s fast-paced, eighty-minute presentation, available on YouTube, was given at SpringOne2GX 2015 with co-presenter, Dr. Dave Syer, founder of Spring Cloud, Spring Boot, and Spring Batch.
As the presenters of Getting Started with Spring Cloud admit, the purpose of the presentation was to get people excited about Spring Cloud and Netflix technologies, not to provide a deep dive into each technology. However, I believe the presentation’s Reservation Service example provides an excellent learning opportunity. In the following post, we will examine the technologies, components, code, and configuration presented in Getting Started with Spring Cloud. The goal of the post is to provide a greater understanding of the Spring Cloud and Spring Cloud Netflix technologies.
System Overview
Technologies
The presentation’s example introduces a dizzying array of technologies, which include:
Spring Boot
Stand-alone, production-grade Spring-based applications
Spring Data REST / Spring HATEOAS
Spring-based applications following HATEOAS principles
Spring Cloud Config
Centralized external configuration management, backed by Git
Netflix Eureka
REST-based service discovery and registration for failover and load-balancing
Netflix Ribbon
IPC library with built-in client-side software load-balancers
Netflix Zuul
Dynamic routing, monitoring, resiliency, security, and more
Netflix Hystrix
Latency and fault tolerance for distributed system
Netflix Hystrix Dashboard
Web-based UI for monitoring Hystrix
Spring Cloud Stream
Messaging microservices, backed by Redis
Spring Data Redis
Configuration and access to Redis from a Spring app, using Jedis
Spring Cloud Sleuth
Distributed tracing solution for Spring Cloud, sends traces via Thrift to the Zipkin collector service
Twitter Zipkin
Distributed tracing system, backed by Apache Cassandra
H2
In-memory Java SQL database, embedded and server modes
Docker
Package applications with dependencies into standardized Linux containers
System Components
Several components and component sub-systems comprise the presentation’s overall Reservation Service example. Each component implements a combination of the technologies mentioned above. Below is a high-level architectural diagram of the presentation’s example. It includes a few additional features, added as part of this post.

Individual system components include:
Spring Cloud Config Server
Stand-alone Spring Boot application provides centralized external configuration to multiple Reservation system components
Spring Cloud Config Git Repo
Git repository containing multiple Reservation system components configuration files, served by Spring Cloud Config Server
H2 Java SQL Database Server (New)
This post substitutes the original example’s use of H2’s embedded version with a TCP Server instance, shared by Reservation Service instances
Reservation Service
Multi load-balanced instances of stand-alone Spring Boot application, backed by H2 database
Reservation Client
Stand-alone Spring Boot application (aka edge service or client-side proxy), forwards client-side load-balanced requests to the Reservation Service, using Eureka, Zuul, and Ribbon
Reservation Data Seeder (New)
Stand-alone Spring Boot application, seeds H2 with initial data, instead of the Reservation Service
Eureka Service
Stand-alone Spring Boot application provides service discovery and registration for failover and load-balancing
Hystrix Dashboard
Stand-alone Spring Boot application provides web-based Hystrix UI for monitoring system performance and Hystrix circuit-breakers
Zipkin
Zipkin Collector, Query, and Web, and Cassandra database, receives, correlates, and displays traces from Spring Cloud Sleuth
Redis
In-memory data structure store, acting as message broker/transport for Spring Cloud Stream
Github
All the code for this post is available on Github, split between two repositories. The first repository, spring-cloud-demo, contains the source code for all of the components listed above, except the Spring Cloud Config Git Repo. To function correctly, the configuration files, consumed by the Spring Cloud Config Server, needs to be placed into a separate repository, spring-cloud-demo-config-repo.
The first repository contains a git submodule , docker-zipkin. If you are not familiar with submodules, you may want to take a moment to read the git documentation. The submodule contains a dockerized version of Twitter’s OpenZipkin, docker-zipkin. To clone the two repositories, use the following commands. The --recursive option is required to include the docker-zipkin submodule in the project.
| git clone https://github.com/garystafford/spring-cloud-demo-config-repo.git | |
| git clone --recursive https://github.com/garystafford/spring-cloud-demo.git |
Configuration
To try out the post’s Reservation system example, you need to configure at least one property. The Spring Cloud Config Server needs to know the location of the Spring Cloud Config Repository, which is the second GitHub repository you cloned, spring-cloud-demo-config-repo. From the root of the spring-cloud-demo repo, edit the Spring Cloud Config Server application.properties file, located in config-server/src/main/resources/application.properties. Change the following property’s value to your local path to the spring-cloud-demo-config-repo repository:
| spring.cloud.config.server.git.uri=file:<YOUR_PATH_GOES_HERE>/spring-cloud-demo-config-repo |
Startup
There are a few ways you could run the multiple components that make up the post’s example. I suggest running one component per terminal window, in the foreground. In this way, you can monitor the output from the bootstrap and startup processes of the system’s components. Furthermore, you can continue to monitor the system’s components once they are up and running, and receiving traffic. Yes, that is twelve terminal windows…
There is a required startup order for the components. For example, Spring Cloud Config Server needs to start before the other components that rely on it for configuration. Netflix’s Eureka needs to start before the Reservation Client and ReservationServices, so they can register with Eureka on startup. Similarly, Zipkin needs to be started in its Docker container before the Reservation Client and Services, so Spring Cloud Sleuth can start sending traces. Redis needs to be started in its Docker container before Spring Cloud Stream tries to create the message queue. All instances of the Reservation Service needs to start before the Reservation Client. Once every component is started, the Reservation Data Seeder needs to be run once to create initial data in H2. For best results, follow the instructions below. Let each component start completely, before starting the next component.
| # IMPORTANT: set this to the spring-cloud-demo repo directory | |
| export SPRING_DEMO=<YOUR_PATH_GOES_HERE>/spring-cloud-demo | |
| # Redis - on Mac, in Docker Quickstart Terminal | |
| cd ${SPRING_DEMO}/docker-redis/ | |
| docker-compose up | |
| # Zipkin - on Mac, in Docker Quickstart Terminal | |
| cd ${SPRING_DEMO}/docker-zipkin/ | |
| docker-compose up | |
| # *** MAKE SURE ZIPKIN STARTS SUCCESSFULLY! *** | |
| # *** I HAVE TO RESTART >50% OF TIME... *** | |
| # H2 Database Server - in new terminal window | |
| cd ${SPRING_DEMO}/h2-server | |
| java -cp h2*.jar org.h2.tools.Server -webPort 6889 | |
| # Spring Cloud Config Server - in new terminal window | |
| cd ${SPRING_DEMO}/config-server | |
| mvn clean package spring-boot:run | |
| # Eureka Service - in new terminal window | |
| cd ${SPRING_DEMO}/eureka-server | |
| mvn clean package spring-boot:run | |
| # Hystrix Dashboard - in new terminal window | |
| cd ${SPRING_DEMO}/hystrix-dashboard | |
| mvn clean package spring-boot:run | |
| # Reservation Service - instance 1 - in new terminal window | |
| cd ${SPRING_DEMO}/reservation-service | |
| mvn clean package | |
| mvn spring-boot:run -Drun.jvmArguments='-Dserver.port=8000' | |
| # Reservation Service - instance 2 - in new terminal window | |
| cd ${SPRING_DEMO}/reservation-service | |
| mvn spring-boot:run -Drun.jvmArguments='-Dserver.port=8001' | |
| # Reservation Service - instance 3 - in new terminal window | |
| cd ${SPRING_DEMO}/reservation-service | |
| mvn spring-boot:run -Drun.jvmArguments='-Dserver.port=8002' | |
| # Reservation Client - in new terminal window | |
| cd ${SPRING_DEMO}/reservation-client | |
| mvn clean package spring-boot:run | |
| # Load seed data into H2 - in new terminal window | |
| cd ${SPRING_DEMO}/reservation-data-seeder | |
| mvn clean package spring-boot:run | |
| # Redis redis-cli monitor - on Mac, in new Docker Quickstart Terminal | |
| docker exec -it dockerredis_redis_1 redis-cli | |
| 127.0.0.1:6379> monitor |
Docker
Both Zipkin and Redis run in Docker containers. Redis runs in a single container. Zipkin’s four separate components run in four separate containers. Be advised, Zipkin seems to have trouble successfully starting all four of its components on a consistent basis. I believe it’s a race condition caused by Docker Compose simultaneously starting the four Docker containers, ignoring a proper startup order. More than half of the time, I have to stop Zipkin and rerun the docker command to get Zipkin to start without any errors.
If you’ve followed the instructions above, you should see the following Docker images and Docker containers installed and running in your local environment.
| docker is configured to use the default machine with IP 192.168.99.100 | |
| gstafford@nagstaffo:~$ docker images | |
| REPOSITORY TAG IMAGE ID CREATED VIRTUAL SIZE | |
| redis latest 8bccd73928d9 5 weeks ago 151.3 MB | |
| openzipkin/zipkin-cassandra 1.30.0 8bbc92bceff0 5 weeks ago 221.9 MB | |
| openzipkin/zipkin-web 1.30.0 c854ecbcef86 5 weeks ago 155.1 MB | |
| openzipkin/zipkin-query 1.30.0 f0c45a26988a 5 weeks ago 180.3 MB | |
| openzipkin/zipkin-collector 1.30.0 5fcf0ba455a0 5 weeks ago 183.8 MB | |
| gstafford@nagstaffo:~$ docker ps -a | |
| CONTAINER ID IMAGE COMMAND CREATED STATUS PORTS NAMES | |
| 1fde6bb2dc99 openzipkin/zipkin-web:1.30.0 "/usr/local/bin/run" 3 weeks ago Up 11 days 0.0.0.0:8080->8080/tcp, 0.0.0.0:9990->9990/tcp dockerzipkin_web_1 | |
| 16e65180296e openzipkin/zipkin-query:1.30.0 "/usr/local/bin/run.s" 3 weeks ago Up 11 days 0.0.0.0:9411->9411/tcp, 0.0.0.0:9901->9901/tcp dockerzipkin_query_1 | |
| b1ca16408274 openzipkin/zipkin-collector:1.30.0 "/usr/local/bin/run.s" 3 weeks ago Up 11 days 0.0.0.0:9410->9410/tcp, 0.0.0.0:9900->9900/tcp dockerzipkin_collector_1 | |
| c7195ee9c4ff openzipkin/zipkin-cassandra:1.30.0 "/bin/sh -c /usr/loca" 3 weeks ago Up 11 days 7000-7001/tcp, 7199/tcp, 9160/tcp, 0.0.0.0:9042->9042/tcp dockerzipkin_cassandra_1 | |
| fe0396908e29 redis "/entrypoint.sh redis" 3 weeks ago Up 11 days 0.0.0.0:6379->6379/tcp dockerredis_redis_1 |
Components
Spring Cloud Config Server
At the center of the Reservation system is Spring Cloud Config. Configuration, typically found in the application.properties file, for the Reservation Services, Reservation Client, Reservation Data Seeder, Eureka Service, and Hystix Dashboard, has been externalized with Spring Cloud Config.
Each component has a bootstrap.properties file, which modifies its startup behavior during the bootstrap phase of an application context. Each bootstrap.properties file contains the component’s name and the address of the Spring Cloud Config Server. Components retrieve their configuration from the Spring Cloud Config Server at runtime. Below, is an example of the Reservation Client’s bootstrap.properties file.
| # reservation client bootstrap props | |
| spring.application.name=reservation-client | |
| spring.cloud.config.uri=http://localhost:8888 |
Spring Cloud Config Git Repo
In the presentation, as in this post, the Spring Cloud Config Server is backed by a locally cloned Git repository, the Spring Cloud Config Git Repo. The Spring Cloud Config Server’s application.properties file contains the address of the Git repository. Each properties file within the Git repository corresponds to a system component. Below, is an example of the reservation-client.properties file, from the Spring Cloud Config Git Repo.
| # reservation client app props | |
| server.port=8050 | |
| message=Spring Cloud Config: Reservation Client | |
| # spring cloud stream / redis | |
| spring.cloud.stream.bindings.output=reservations | |
| spring.redis.host=192.168.99.100 | |
| spring.redis.port=6379 | |
| # zipkin / spring cloud sleuth | |
| spring.zipkin.host=192.168.99.100 | |
| spring.zipkin.port=9410 |
As shown in the original presentation, the configuration files can be viewed using HTTP endpoints of the Spring Cloud Config Server. To view the Reservation Service’s configuration stored in the Spring Cloud Config Git Repo, issue an HTTP GET request to http://localhost:8888/reservation-service/master. The master URI refers to the Git repo branch in which the configuration resides. This will return the configuration, in the response body, as JSON:

In a real Production environment, the Spring Cloud Config Server would be backed by a highly-available Git Server or GitHub repository.
Reservation Service
The Reservation Service is the core component in the presentation’s example. The Reservation Service is a stand-alone Spring Boot application. By implementing Spring Data REST and Spring HATEOAS, Spring automatically creates REST representations from the Reservation JPA Entity class of the Reservation Service. There is no need to write a Spring Rest Controller and explicitly code each endpoint.

Spring HATEOAS allows us to interact with the Reservation Entity, using HTTP methods, such as GET and POST. These endpoints, along with all addressable endpoints, are displayed in the terminal output when a Spring Boot application starts. For example, we can use an HTTP GET request to call the reservations/{id} endpoint, such as:
| curl -X GET -H "Content-Type: application/json" \ | |
| --url 'http://localhost:8000/reservations' | |
| curl -X GET -H "Content-Type: application/json" \ | |
| --url 'http://localhost:8000/reservations/2' |
The Reservation Service also makes use of the Spring RepositoryRestResource annotation. By annotating the RepositoryReservation Interface, which extends JpaRepository, we can customize export mapping and relative paths of the Reservation JPA Entity class. As shown below, the RepositoryReservation Interface contains the findByReservationName method signature, annotated with /by-name endpoint, which accepts the rn input parameter.
| @RepositoryRestResource | |
| interface ReservationRepository extends JpaRepository<Reservation, Long> { | |
| @RestResource(path = "by-name") | |
| Collection<Reservation> findByReservationName(@Param("rn") String rn); | |
| } |
Calling the findByReservationName method, we can search for a particular reservation by using an HTTP GET request to call the reservations/search/by-name?rn={reservationName} endpoint.
| curl -X GET -H "Content-Type: application/json" \ | |
| --url 'http://localhost:8000/reservations/search/by-name?rn=Amit' |

Reservation Client
Querying the Reservation Service directly is possible, however, is not the recommended. Instead, the presentation suggests using the Reservation Client as a proxy to the Reservation Service. The presentation offers three examples of using the Reservation Client as a proxy.
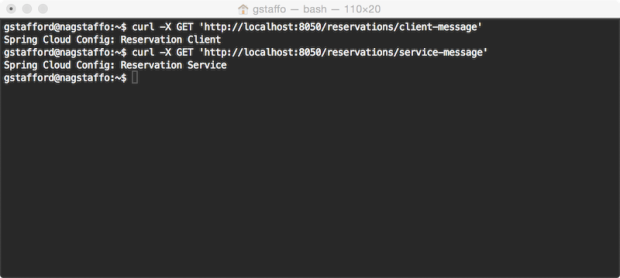
The first demonstration of the Reservation Client uses the /message endpoint on the Reservation Client to return a string from the Reservation Service. The message example has been modified to include two new endpoints on the Reservation Client. The first endpoint, /reservations/client-message, returns a message directly from the Reservation Client. The second endpoint, /reservations/service-message, returns a message indirectly from the Reservation Service. To retrieve the message from the Reservation Service, the Reservation Client sends a request to the endpoint Reservation Service’s /message endpoint.
| @RequestMapping(path = "/client-message", method = RequestMethod.GET) | |
| public String getMessage() { | |
| return this.message; | |
| } | |
| @RequestMapping(path = "/service-message", method = RequestMethod.GET) | |
| public String getReservationServiceMessage() { | |
| return this.restTemplate.getForObject( | |
| "http://reservation-service/message", | |
| String.class); | |
| } |
To retrieve both messages, send separate HTTP GET requests to each endpoint:
| curl 'http://localhost:8050/reservations/client-message' | |
| curl 'http://localhost:8050/reservations/service-message' |
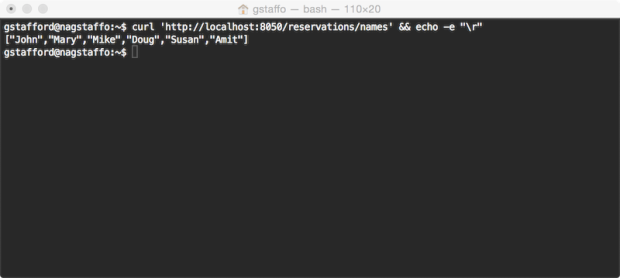
The second demonstration of the Reservation Client uses a Data Transfer Object (DTO). Calling the Reservation Client’s reservations/names endpoint, invokes the getReservationNames method. This method, in turn, calls the Reservation Service’s /reservations endpoint. The response object returned from the Reservation Service, a JSON array of reservation records, is deserialized and mapped to the Reservation Client’s Reservation DTO. Finally, the method returns a collection of strings, representing just the names from the reservations.
| @RequestMapping(path = "/names", method = RequestMethod.GET) | |
| public Collection<String> getReservationNames() { | |
| ParameterizedTypeReference<Resources<Reservation>> ptr = | |
| new ParameterizedTypeReference<Resources<Reservation>>() {}; | |
| return this.restTemplate.exchange("http://reservation-service/reservations", GET, null, ptr) | |
| .getBody() | |
| .getContent() | |
| .stream() | |
| .map(Reservation::getReservationName) | |
| .collect(toList()); | |
| } |
To retrieve the collection of reservation names, an HTTP GET request is sent to the /reservations/names endpoint:
| curl 'http://localhost:8050/reservations/names' |
Spring Cloud Stream
One of the more interesting technologies in the presentation is Spring’s Spring Cloud Stream. The Spring website describes Spring Cloud Stream as a project that allows users to develop and run messaging microservices using Spring Integration. In other words, it provides native Spring messaging capabilities, backed by a choice of message buses, including Redis, RabbitMQ, and Apache Kafka, to Spring Boot applications.
A detailed explanation of Spring Cloud Stream would take an entire post. The best technical demonstration I have found is the presentation, Message Driven Microservices in the Cloud, by speakers Dr. David Syer and Dr. Mark Pollack, given in January 2016, also at SpringOne2GX 2015.

In the presentation, a new reservation is submitted via an HTTP POST to the acceptNewReservations method of the Reservation Client. The method, in turn, builds (aka produces) a message, containing the new reservation, and publishes that message to the queue.reservation queue.
| @Autowired | |
| @Output(OUTPUT) | |
| private MessageChannel messageChannel; | |
| @Value("${message}") | |
| private String message; | |
| @Description("Post new reservations using Spring Cloud Stream") | |
| @RequestMapping(method = POST) | |
| public void acceptNewReservations(@RequestBody Reservation r) { | |
| Message<String> build = withPayload(r.getReservationName()).build(); | |
| this.messageChannel.send(build); | |
| } |
The queue.reservation queue is located in Redis, which is running inside a Docker container. To view the messages being published to the queue in real-time, use the redis-cli, with the monitor command, from within the Redis Docker container. Below is an example of tests messages pushed (LPUSH) to the reservations queue from the Reservation Client.
| gstafford@nagstaffo:~$ docker exec -it dockerredis_redis_1 redis-cli | |
| 127.0.0.1:6379> monitor | |
| OK | |
| 1455332771.709412 [0 192.168.99.1:62177] "BRPOP" "queue.reservations" "1" | |
| 1455332772.110386 [0 192.168.99.1:59782] "BRPOP" "queue.reservations" "1" | |
| 1455332773.689777 [0 192.168.99.1:62183] "LPUSH" "queue.reservations" "\xff\x04\x0bcontentType\x00\x00\x00\x0c\"text/plain\"\tX-Span-Id\x00\x00\x00&\"49a5b1d1-e7e9-46de-9d9f-647d5b19a77b\"\nX-Trace-Id\x00\x00\x00&\"49a5b1d1-e7e9-46de-9d9f-647d5b19a77b\"\x0bX-Span-Name\x00\x00\x00\x13\"http/reservations\"Test-Name-01" | |
| 1455332777.124788 [0 192.168.99.1:59782] "BRPOP" "queue.reservations" "1" | |
| 1455332777.425655 [0 192.168.99.1:59776] "BRPOP" "queue.reservations" "1" | |
| 1455332777.581693 [0 192.168.99.1:62183] "LPUSH" "queue.reservations" "\xff\x04\x0bcontentType\x00\x00\x00\x0c\"text/plain\"\tX-Span-Id\x00\x00\x00&\"32db0e25-982a-422f-88bb-2e7c2e4ce393\"\nX-Trace-Id\x00\x00\x00&\"32db0e25-982a-422f-88bb-2e7c2e4ce393\"\x0bX-Span-Name\x00\x00\x00\x13\"http/reservations\"Test-Name-02" | |
| 1455332781.442398 [0 192.168.99.1:59776] "BRPOP" "queue.reservations" "1" | |
| 1455332781.643077 [0 192.168.99.1:62177] "BRPOP" "queue.reservations" "1" | |
| 1455332781.669264 [0 192.168.99.1:62183] "LPUSH" "queue.reservations" "\xff\x04\x0bcontentType\x00\x00\x00\x0c\"text/plain\"\tX-Span-Id\x00\x00\x00&\"85ebf225-3324-434e-ba38-17411db745ac\"\nX-Trace-Id\x00\x00\x00&\"85ebf225-3324-434e-ba38-17411db745ac\"\x0bX-Span-Name\x00\x00\x00\x13\"http/reservations\"Test-Name-03" | |
| 1455332785.452291 [0 192.168.99.1:59776] "BRPOP" "queue.reservations" "1" | |
| 1455332785.652809 [0 192.168.99.1:62177] "BRPOP" "queue.reservations" "1" | |
| 1455332785.706438 [0 192.168.99.1:62183] "LPUSH" "queue.reservations" "\xff\x04\x0bcontentType\x00\x00\x00\x0c\"text/plain\"\tX-Span-Id\x00\x00\x00&\"aaad3210-cfda-49b9-ba34-a1e8c1b2995c\"\nX-Trace-Id\x00\x00\x00&\"aaad3210-cfda-49b9-ba34-a1e8c1b2995c\"\x0bX-Span-Name\x00\x00\x00\x13\"http/reservations\"Test-Name-04" | |
| 1455332789.665349 [0 192.168.99.1:62177] "BRPOP" "queue.reservations" "1" | |
| 1455332789.764794 [0 192.168.99.1:59782] "BRPOP" "queue.reservations" "1" | |
| 1455332790.064547 [0 192.168.99.1:62183] "LPUSH" "queue.reservations" "\xff\x04\x0bcontentType\x00\x00\x00\x0c\"text/plain\"\tX-Span-Id\x00\x00\x00&\"545ce7b9-7ba4-42ae-8d2a-374ec7914240\"\nX-Trace-Id\x00\x00\x00&\"545ce7b9-7ba4-42ae-8d2a-374ec7914240\"\x0bX-Span-Name\x00\x00\x00\x13\"http/reservations\"Test-Name-05" | |
| 1455332790.070190 [0 192.168.99.1:59776] "BRPOP" "queue.reservations" "1" | |
| 1455332790.669056 [0 192.168.99.1:62177] "BRPOP" "queue.reservations" "1" |
The published messages are consumed by subscribers to the reservation queue. In this example, the consumer is the Reservation Service. The Reservation Service’s acceptNewReservation method processes the message and saves the new reservation to the H2 database. In Spring Cloud Stream terms, the Reservation Client is the Sink.
| @MessageEndpoint | |
| class ReservationProcessor { | |
| @Autowired | |
| private ReservationRepository reservationRepository; | |
| @ServiceActivator(inputChannel = INPUT) | |
| public void acceptNewReservation(String rn) { | |
| this.reservationRepository.save(new Reservation(rn)); | |
| } | |
| } |
Netflix Eureka
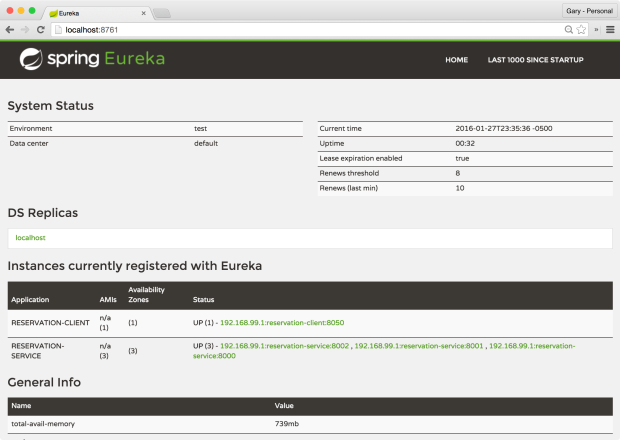
Netflix’s Eureka, in combination with Netflix’s Zuul and Ribbon, provide the ability to scale the Reservation Service horizontally, and to load balance those instances. By using the @EnableEurekaClient annotation on the Reservation Client and Reservation Services, each instance will automatically register with Eureka on startup, as shown in the Eureka Web UI, below.

The names of the registered instances are in three parts: the address of the host on which the instance is running, followed by the value of the spring.application.name property of the instance’s bootstrap.properties file, and finally, the port number the instance is running on. Eureka displays each instance’s status, along with additional AWS information, if you are running on AWS, as Netflix does.

According to Spring in their informative post, Spring Cloud, service discovery is one of the key tenets of a microservice based architecture. Trying to hand-configure each client, or to rely on convention over configuration, can be difficult to do and is brittle. Eureka is the Netflix Service Discovery Server and Client. A client (Spring Boot application), registers with Eureka, providing metadata about itself. Eureka then receives heartbeat messages from each instance. If the heartbeat fails over a configurable timetable, the instance is normally removed from the registry.
The Reservation Client application is also annotated with @EnableZuulProxy. Adding this annotation pulls in Spring Cloud’s embedded Zuul proxy. Again, according to Spring, the proxy is used by front-end applications to proxy calls to one or more back-end services, avoiding the need to manage CORS and authentication concerns independently for all the backends. In the presentation and this post, the front end is the Reservation Client and the back end is the Reservation Service.
In the code snippet below from the ReservationApiGatewayRestController, note the URL of the endpoint requested in the getReservationNames method. Instead of directly calling http://localhost:8000/reservations, the method calls http://reservation-service/reservations. The reservation-service segment of the URL is the registered name of the service in Eureka and contained in the Reservation Service’s bootstrap.properties file.
| @RequestMapping(path = "/names", method = RequestMethod.GET) | |
| public Collection<String> getReservationNames() { | |
| ParameterizedTypeReference<Resources<Reservation>> ptr = | |
| new ParameterizedTypeReference<Resources<Reservation>>() {}; | |
| return this.restTemplate.exchange("http://reservation-service/reservations", GET, null, ptr) | |
| .getBody() | |
| .getContent() | |
| .stream() | |
| .map(Reservation::getReservationName) | |
| .collect(toList()); | |
| } |
In the following abridged output from the Reservation Client, you can clearly see the interaction of Zuul, Ribbon, Eureka, and Spring Cloud Config. Note the Client application has successfully registering itself with Eureka, along with the Reservation Client’s status. Also, note Zuul mapping the Reservation Service’s URL path.
| 2016-01-28 00:00:03.667 INFO 17223 --- [ main] com.netflix.discovery.DiscoveryClient : Getting all instance registry info from the eureka server | |
| 2016-01-28 00:00:03.813 INFO 17223 --- [ main] com.netflix.discovery.DiscoveryClient : The response status is 200 | |
| 2016-01-28 00:00:03.814 INFO 17223 --- [ main] com.netflix.discovery.DiscoveryClient : Starting heartbeat executor: renew interval is: 30 | |
| 2016-01-28 00:00:03.817 INFO 17223 --- [ main] c.n.discovery.InstanceInfoReplicator : InstanceInfoReplicator onDemand update allowed rate per min is 4 | |
| 2016-01-28 00:00:03.935 INFO 17223 --- [ main] c.n.e.EurekaDiscoveryClientConfiguration : Registering application reservation-client with eureka with status UP | |
| 2016-01-28 00:00:03.936 INFO 17223 --- [ main] com.netflix.discovery.DiscoveryClient : Saw local status change event StatusChangeEvent [current=UP, previous=STARTING] | |
| 2016-01-28 00:00:03.941 INFO 17223 --- [nfoReplicator-0] com.netflix.discovery.DiscoveryClient : DiscoveryClient_RESERVATION-CLIENT/192.168.99.1:reservation-client:8050: registering service... | |
| 2016-01-28 00:00:03.942 INFO 17223 --- [ main] o.s.c.n.zuul.web.ZuulHandlerMapping : Mapped URL path [/reservation-service/**] onto handler of type [class org.springframework.cloud.netflix.zuul.web.ZuulController] | |
| 2016-01-28 00:00:03.981 INFO 17223 --- [nfoReplicator-0] com.netflix.discovery.DiscoveryClient : DiscoveryClient_RESERVATION-CLIENT/192.168.99.1:reservation-client:8050 - registration status: 204 | |
| 2016-01-28 00:00:04.075 INFO 17223 --- [ main] s.b.c.e.t.TomcatEmbeddedServletContainer : Tomcat started on port(s): 8050 (http) | |
| 2016-01-28 00:00:04.076 INFO 17223 --- [ main] c.n.e.EurekaDiscoveryClientConfiguration : Updating port to 8050 | |
| 2016-01-28 00:00:04.080 INFO 17223 --- [ main] c.example.ReservationClientApplication : Started ReservationClientApplication in 9.172 seconds (JVM running for 12.536) |
Load Balancing
One shortcoming of the original presentation was true load balancing. With only a single instance of the Reservation Service in the original presentation, there is nothing to load balance; it’s more of a reverse proxy example. To demonstrate load balancing, we need to spin up additional instances of the Reservation Service. Following the post’s component start-up instructions, we should have three instances of the Reservation Service running, on ports 8000, 8001, and 8002, each in separate terminal windows.
To confirm the three instances of the Reservation Service were successfully registered with Eureka, review the output from the Eureka Server terminal window. The output should show three instances of the Reservation Service registering on startup, in addition to the Reservation Client.
| 2016-01-27 23:34:40.496 INFO 16668 --- [nio-8761-exec-9] c.n.e.registry.AbstractInstanceRegistry : Registered instance RESERVATION-SERVICE/192.168.99.1:reservation-service:8000 with status UP (replication=false) | |
| 2016-01-27 23:34:53.167 INFO 16668 --- [nio-8761-exec-7] c.n.e.registry.AbstractInstanceRegistry : Registered instance RESERVATION-SERVICE/192.168.99.1:reservation-service:8001 with status UP (replication=false) | |
| 2016-01-27 23:34:55.924 INFO 16668 --- [nio-8761-exec-1] c.n.e.registry.AbstractInstanceRegistry : Registered instance RESERVATION-SERVICE/192.168.99.1:reservation-service:8002 with status UP (replication=false) | |
| 2016-01-27 23:40:35.963 INFO 16668 --- [nio-8761-exec-5] c.n.e.registry.AbstractInstanceRegistry : Registered instance RESERVATION-CLIENT/192.168.99.1:reservation-client:8050 with status UP (replication=false) |
Viewing Eureka’s web console, we should observe three members in the pool of Reservation Services.
Lastly, looking at the terminal output of the Reservation Client, we should see three instances of the Reservation Service being returned by Ribbon (aka the DynamicServerListLoadBalancer).
| 2016-01-27 23:41:01.357 INFO 17125 --- [estController-1] c.netflix.config.ChainedDynamicProperty : Flipping property: reservation-service.ribbon.ActiveConnectionsLimit to use NEXT property: niws.loadbalancer.availabilityFilteringRule.activeConnectionsLimit = 2147483647 | |
| 2016-01-27 23:41:01.359 INFO 17125 --- [estController-1] c.n.l.DynamicServerListLoadBalancer : DynamicServerListLoadBalancer for client reservation-service initialized: DynamicServerListLoadBalancer:{NFLoadBalancer:name=reservation-service,current list of Servers=[192.168.99.1:8000, 192.168.99.1:8002, 192.168.99.1:8001],Load balancer stats=Zone stats: {defaultzone=[Zone:defaultzone; Instance count:3; Active connections count: 0; Circuit breaker tripped count: 0; Active connections per server: 0.0;] | |
| },Server stats: [[Server:192.168.99.1:8000; Zone:defaultZone; Total Requests:0; Successive connection failure:0; Total blackout seconds:0; Last connection made:Wed Dec 31 19:00:00 EST 1969; First connection made: Wed Dec 31 19:00:00 EST 1969; Active Connections:0; total failure count in last (1000) msecs:0; average resp time:0.0; 90 percentile resp time:0.0; 95 percentile resp time:0.0; min resp time:0.0; max resp time:0.0; stddev resp time:0.0] | |
| , [Server:192.168.99.1:8001; Zone:defaultZone; Total Requests:0; Successive connection failure:0; Total blackout seconds:0; Last connection made:Wed Dec 31 19:00:00 EST 1969; First connection made: Wed Dec 31 19:00:00 EST 1969; Active Connections:0; total failure count in last (1000) msecs:0; average resp time:0.0; 90 percentile resp time:0.0; 95 percentile resp time:0.0; min resp time:0.0; max resp time:0.0; stddev resp time:0.0] | |
| , [Server:192.168.99.1:8002; Zone:defaultZone; Total Requests:0; Successive connection failure:0; Total blackout seconds:0; Last connection made:Wed Dec 31 19:00:00 EST 1969; First connection made: Wed Dec 31 19:00:00 EST 1969; Active Connections:0; total failure count in last (1000) msecs:0; average resp time:0.0; 90 percentile resp time:0.0; 95 percentile resp time:0.0; min resp time:0.0; max resp time:0.0; stddev resp time:0.0] | |
| ]}ServerList:org.springframework.cloud.netflix.ribbon.eureka.DomainExtractingServerList@6e7a0f39 | |
| 2016-01-27 23:41:01.391 INFO 17125 --- [estController-1] com.netflix.http4.ConnectionPoolCleaner : Initializing ConnectionPoolCleaner for NFHttpClient:reservation-service | |
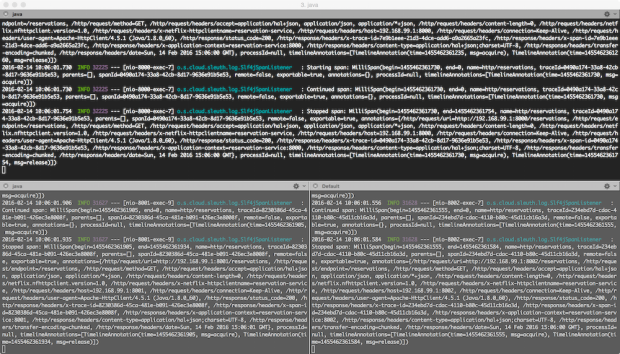
| 2016-01-27 23:41:01.828 INFO 17125 --- [nio-8050-exec-1] o.s.cloud.sleuth.log.Slf4jSpanListener : Stopped span: MilliSpan(begin=1453956061003, end=1453956061818, name=http/reservations/names, traceId=1f06b3ce-a5b9-4689-b1e7-22fb1f3ee10d, parents=[], spanId=1f06b3ce-a5b9-4689-b1e7-22fb1f3ee10d, remote=false, exportable=true, annotations={/http/request/uri=http://localhost:8050/reservations/names, /http/request/endpoint=/reservations/names, /http/request/method=GET, /http/request/headers/host=localhost:8050, /http/request/headers/connection=keep-alive, /http/request/headers/user-agent=Mozilla/5.0 (Macintosh; Intel Mac OS X 10_10_5) AppleWebKit/537.36 (KHTML, like Gecko) Chrome/47.0.2526.111 Safari/537.36, /http/request/headers/cache-control=no-cache, /http/request/headers/postman-token=0ee95302-3af6-b08a-a784-43490d74925b, /http/request/headers/content-type=application/json, /http/request/headers/accept=*/*, /http/request/headers/accept-encoding=gzip, deflate, sdch, /http/request/headers/accept-language=en-US,en;q=0.8, /http/response/status_code=200, /http/response/headers/x-trace-id=1f06b3ce-a5b9-4689-b1e7-22fb1f3ee10d, /http/response/headers/x-span-id=1f06b3ce-a5b9-4689-b1e7-22fb1f3ee10d, /http/response/headers/x-application-context=reservation-client:8050, /http/response/headers/content-type=application/json;charset=UTF-8, /http/response/headers/transfer-encoding=chunked, /http/response/headers/date=Thu, 28 Jan 2016 04:41:01 GMT}, processId=null, timelineAnnotations=[TimelineAnnotation(time=1453956061004, msg=acquire), TimelineAnnotation(time=1453956061818, msg=release)]) | |
| 2016-01-27 23:41:02.345 INFO 17125 --- [ool-14-thread-1] c.netflix.config.ChainedDynamicProperty : Flipping property: reservation-service.ribbon.ActiveConnectionsLimit to use NEXT property: niws.loadbalancer.availabilityFilteringRule.activeConnectionsLimit = 2147483647 |
Requesting http://localhost:8050/reservations/names, Ribbon forwards the request to one of the three Reservation Service instances registered with Eureka. By default, Ribbon uses a round-robin load-balancing strategy to select an instance from the pool of available Reservation Services.
H2 Server
The original presentation’s Reservation Service used an embedded instance of H2. To scale out the Reservation Service, we need a common database for multiple instances to share. Otherwise, queries would return different results, specific to the particular instance of Reservation Service chosen by the load-balancer. To solve this, the original presentation’s embedded version of H2 has been replaced with the TCP Server client/server version of H2.

Thanks to more Spring magic, the only change we need to make to the original presentation’s code is a few additional properties added to the Reservation Service’s reservation-service.properties file. This changes H2 from the embedded version to the TCP Server version.
| # reservation service app props | |
| message=Spring Cloud Config: Reservation Service\n | |
| # h2 database server | |
| spring.datasource.url=jdbc:h2:tcp://localhost/~/reservationdb | |
| spring.datasource.username=dbuser | |
| spring.datasource.password=dbpass | |
| spring.datasource.driver-class-name=org.h2.Driver | |
| spring.jpa.hibernate.ddl-auto=validate | |
| # spring cloud stream / redis | |
| spring.cloud.stream.bindings.input=reservations | |
| spring.redis.host=192.168.99.100 | |
| spring.redis.port=6379 | |
| # zipkin / spring cloud sleuth | |
| spring.zipkin.host=192.168.99.100 | |
| spring.zipkin.port=9410 |
Reservation Data Seeder
In the original presentation, the Reservation Service created several sample reservation records in its embedded H2 database on startup. Since we now have multiple instances of the Reservation Service running, the sample data creation task has been moved from the Reservation Service to the new Reservation Data Seeder. The Reservation Service only now validates the H2 database schema on startup. The Reservation Data Seeder now updates the schema based on its entities. This also means the seed data will be persisted across restarts of the Reservation Service, unlike in the original configuration.
| # reservation data seeder app props | |
| # h2 database server | |
| spring.datasource.url=jdbc:h2:tcp://localhost/~/reservationdb | |
| spring.datasource.username=dbuser | |
| spring.datasource.password=dbpass | |
| spring.datasource.driver-class-name=org.h2.Driver | |
| spring.h2.console.enabled=true | |
| spring.jpa.hibernate.ddl-auto=update |
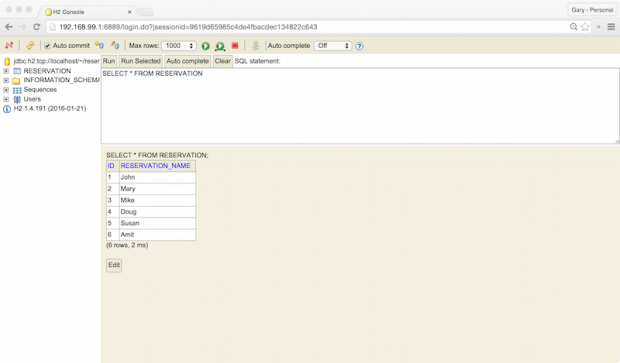
Running the Reservation Data Seeder once will create several reservation records into the H2 database. To confirm the H2 Server is running and the initial reservation records were created by the Reservation Data Seeder, point your web browser to the H2 login page at http://192.168.99.1:6889. and log in using the credentials in the reservation-service.properties file.

The H2 Console should contain the RESERVATION table, which holds the reservation sample records.
Spring Cloud Sleuth and Twitter’s Zipkin
According to the project description, “Spring Cloud Sleuth implements a distributed tracing solution for Spring Cloud. All your interactions with external systems should be instrumented automatically. You can capture data simply in logs, or by sending it to a remote collector service.” In our case, that remote collector service is Zipkin.
Zipkin describes itself as, “a distributed tracing system. It helps gather timing data needed to troubleshoot latency problems in microservice architectures. It manages both the collection and lookup of this data through a Collector and a Query service.” Zipkin provides critical insights into how microservices perform in a distributed system.

In the presentation, as in this post, the Reservation Client’s main ReservationClientApplication class contains the alwaysSampler bean, which returns a new instance of org.springframework.cloud.sleuth.sampler.AlwaysSampler. As long as Spring Cloud Sleuth is on the classpath and you have added alwaysSampler bean, the Reservation Client will automatically generate trace data.
| @Bean | |
| AlwaysSampler alwaysSampler() { | |
| return new AlwaysSampler(); | |
| } |
Sending a request to the Reservation Client’s service/message endpoint (http://localhost:8050/reservations/service-message,), will generate a trace, composed of spans. in this case, the spans are individual segments of the HTTP request/response lifecycle. Traces are sent by Sleuth to Zipkin, to be collected. According to Spring, if spring-cloud-sleuth-zipkin is available, then the application will generate and collect Zipkin-compatible traces using Brave). By default, it sends them via Apache Thrift to a Zipkin collector service on port 9410.
Zipkin’s web-browser interface, running on port 8080, allows us to view traces and drill down into individual spans.

Zipkin contains fine-grain details about each span within a trace, as shown below.

Correlation IDs
Note the x-trace-id and x-span-id in the request header, shown below. Sleuth injects the trace and span IDs to the SLF4J MDC (Simple Logging Facade for Java – Mapped Diagnostic Context). According to Spring, IDs provides the ability to extract all the logs from a given trace or span in a log aggregator. The use of correlation IDs and log aggregation are essential for monitoring and supporting a microservice architecture.

Hystix and Hystrix Dashboard
The last major technology highlighted in the presentation is Netflix’s Hystrix. According to Netflix, “Hystrix is a latency and fault tolerance library designed to isolate points of access to remote systems, services, and 3rd party libraries, stop cascading failure and enable resilience in complex distributed systems where failure is inevitable.” Hystrix is essential, it protects applications from cascading dependency failures, an issue common to complex distributed architectures, with multiple dependency chains. According to Netflix, Hystrix uses multiple isolation techniques, such as bulkhead, swimlane, and circuit breaker patterns, to limit the impact of any one dependency on the entire system.
The presentation demonstrates one of the simpler capabilities of Hystrix, fallback. The getReservationNames method is decorated with the @HystrixCommand annotation. This annotation contains the fallbackMethod. According to Netflix, a graceful degradation of a method is provided by adding a fallback method. Hystrix will call to obtain a default value or values, in case the main command fails. In the presentation’s example, the Reservation Service, a direct dependency of the Reservation Client, has failed. The Reservation Service failure causes the failure of the Reservation Client.
In the presentation’s example, the Reservation Service, a direct dependency of the Reservation Client, has failed. The Reservation Service failure causes the failure of the Reservation Client’s getReservationNames method to return a collection of reservation names. Hystrix redirects the application to the getReservationNameFallback method. Instead of returning a collection of reservation names, the getReservationNameFallback returns an empty collection, as opposed to an error message to the client.
| public Collection<String> getReservationNameFallback() { | |
| return emptyList(); | |
| } | |
| @HystrixCommand(fallbackMethod = "getReservationNameFallback", commandProperties = { | |
| @HystrixProperty(name = "execution.isolation.thread.timeoutInMilliseconds", value = "3000") | |
| }) | |
| @RequestMapping(path = "/names", method = RequestMethod.GET) | |
| public Collection<String> getReservationNames() { | |
| ParameterizedTypeReference<Resources<Reservation>> ptr = | |
| new ParameterizedTypeReference<Resources<Reservation>>() { | |
| }; | |
| return this.restTemplate.exchange( | |
| "http://reservation-service/reservations", GET, null, ptr) | |
| .getBody() | |
| .getContent() | |
| .stream() | |
| .map(Reservation::getReservationName) | |
| .collect(toList()); | |
| } |
A more relevant example involves Netflix movie recommendation service. In the event a failure of the recommendation service’s method to return a collection of personalized list of movie recommendations to a customer, Hystrix fallbacks to a method that returns a generic list of the most popular movies to the customer. Netflix has determined that, in the event of a failure of their recommendation service, falling back to a generic list of movies is better than returning no movies at all.
The Hystrix Dashboard is a tool, available with Hystrix, to visualize the current state of Hystrix instrumented methods. Although visually simplistic, the dashboard effectively presents the health of calls to external systems, which are wrapped in a HystrixCommand or HystrixObservableCommand.

The Hystrix dashboard is a visual representation of the Hystrix Stream. This stream is a live feed of data sent by the Hystrix instrumented application, in this case, the Reservation Client. For a single Hystrix application, such as the Reservation Client, the feed requested from the application’s hystrix.stream endpoint is http://localhost:8050/hystrix.stream. The dashboard consumes the stream resource’s response and visualizes it in the browser using JavaScript, jQuery, and d3.
In the post, as in the presentation, hitting the Reservation Client with a volume of requests, we observe normal activity in Hystrix Dashboard. All three instances of the Reservation Service are running and returning the collection of reservations from H2, to the Reservation Client.

If all three instances of the Reservation Service fail or the maximum latency is exceeded, the Reservation Client falls back to returning an empty collection in the response body. In the example below, 15 requests, representing 100% of the current traffic, to the getReservationNames method failed and subsequently fell back to return an empty collection. Hystrix succeeded in helping the application gracefully fall back to an alternate response.

Conclusion
It’s easy to see how Spring Cloud and Netflix’s technologies are easily combined to create a performant, horizontally scalable, reliable system. With the addition of a few missing components, such metrics monitoring and log aggregation, this example could easily be scaled up to support a production-grade microservices-based, enterprise software platform.
Gary Stafford
AWS Area Principal Solutions Architect | 10x AWS Certified Pro | DevOps | Data/ML | Serverless | Polyglot Developer | Former ThoughtWorks and Accenture
