Posts Tagged Observability
Brief Introduction to Observability on AWS
Posted by Gary A. Stafford in AWS, Cloud, DevOps on March 9, 2023
Explore the wide variety of Application Performance Monitoring (APM) and Observability options on AWS

APM and Observability
Observability is “the extent to which the internal states of a system can be inferred from externally available data” (Gartner). The three pillars of observability data are metrics, logs, and traces. Application Performance Monitoring (APM), a term commonly associated with observability, is “software that enables the observation and analysis of application health, performance, and user experience” (Gartner).
Additional features often associated with APM and observability products and services include the following (in alphabetical order):
- Advanced Threat Protection (ATP)
- Endpoint Detection and Response (EDR)
- Incident Detection Response (IDR)
- Infrastructure Performance Monitoring (IPM)
- Network Device Monitoring (NDM)
- Network Performance Monitoring (NPM)
- OpenTelemetry (OTel)
- Operational (or Operations) Intelligence Platform
- Predictive Monitoring (predictive analytics / predictive modeling)
- Real User Monitoring (RUM)
- Security Information and Event Management (SIEM)
- Security Orchestration, Automation, and Response (SOAR)
- Synthetic Monitoring (directed monitoring / synthetic testing)
- Threat Visibility and Risk Scoring
- Unified Security and Observability Platform
- User Behavior Analytics (UBA)
Not all features are offered by all vendors. Most vendors tend to specialize in one or more areas. Determining which features are essential to your organization before choosing a solution is vital.
AI/ML
Given the growing volume and real-time nature of observability telemetry, many vendors have started incorporating AI and ML into their products and services to improve correlation, anomaly detection, and mitigation capabilities. Understand how these features can reduce operational burden, enhance insights, and simplify complexity.
Decision Factors
APM and observability tooling choices often come down to a “Build vs. Buy” decision for organizations. In the Cloud, this usually means integrating several individual purpose-built products and services, self-managed open-source projects, or investing in an end-to-end APM or unified observability platform. Other decision factors include the need for solutions to support:
- Hybrid cloud environments (on-premises/Cloud)
- Multi-cloud environments (Public Cloud, SaaS, Supercloud)
- Specialized workloads (e.g., Mainframes, HPC, VMware, SAP, SAS)
- Compliant workloads (e.g., PCI DSS, PII, GDPR, FedRAMP)
- Edge Computing and IoT/IIoT
- AI, ML, and Data Analytics monitoring (AIOps, MLOps, DataOps)
- SaaS observability (SaaS providers who offer monitoring to their end-users as part of their service offering)
- Custom log formats and protocols
Finally, the 5 V’s of big data: Velocity, Volume, Value, Variety, and Veracity, also influence the choice of APM and observability tooling. The real-time nature of the observability data, the sheer volume of the data, the source and type of data, and the sensitivity of the data, will all guide tooling choices based on features and cost.
Organizations can choose fully-managed native AWS services, AWS Partner products and services, often SaaS, self-managed open-source observability tooling, or a combination of options. Many AWS and Partner products and services are commercial versions of popular open-source software (COSS).
AWS Options
- Amazon CloudWatch: Observe and monitor resources and applications you run on AWS in real time. CloudWatch features include Amazon CloudWatch Container, Lambda, Contributor, and Application Insights.
- Amazon Managed Service for Prometheus (AMP): Prometheus-compatible service that monitors and provides alerts on containerized applications and infrastructure at scale. Prometheus is “an open-source systems monitoring and alerting toolkit originally built at SoundCloud.”
- Amazon Managed Grafana (AMG): Commonly paired with AMP, AMG is a fully managed service for Grafana, an open-source analytics platform that “enables you to query, visualize, alert on, and explore your metrics, logs, and traces wherever they are stored.”
- Amazon OpenSearch Service: Based on open-source OpenSearch, this service provides interactive log analytics and real-time application monitoring and includes OpenSearch Dashboards (comparable to Kibana). Recently announced new security analytics features provide threat monitoring, detection, and alerting capabilities.
- AWS X-Ray: Trace user requests through your application, viewed using the X-Ray service map console or integrated with CloudWatch using the CloudWatch console’s X-Ray Traces Service map.
Data Collection, Processing, and Forwarding
- AWS Distro for OpenTelemetry (ADOT): Open-source APIs, libraries, and agents to collect distributed traces and metrics for application monitoring. ADOT is an open-source distribution of OpenTelemetry, a “high-quality, ubiquitous, and portable telemetry [solution] to enable effective observability.”
- AWS for Fluent Bit: Fluent Bit image with plugins for both CloudWatch Logs and Kinesis Data Firehose. Fluent Bit is an open-source, “super fast, lightweight, and highly scalable logging and metrics processor and forwarder.”
Security-focused Monitoring
- AWS CloudTrail: Helps enable operational and risk auditing, governance, and compliance in your AWS environment. CloudTrail records events, including actions taken in the AWS Management Console, AWS Command Line Interface (CLI), AWS SDKs, and APIs.
Partner Options
According to the 2022 Gartner® Magic Quadrant™ — APM & Observability Report, leading vendors commonly used by AWS customers include the following (in alphabetical order):
- AppDynamics (Cisco)
- Datadog
- Dynatrace
- Elastic
- Honeycomb
- Instanta (IBM)
- logz.io
- New Relic
- Splunk
- Sumo Logic
Open Source Options
There are countless open-source observability projects to choose from, including the following (in alphabetical order):
- Elastic: Elastic Stack: Elasticsearch, Kibana, Beats, and Logstash
- Fluentd: Data collector for unified logging layer
- Grafana: Platform for monitoring and observability
- Jaeger: End-to-end distributed tracing
- Kiali: Configure, visualize, validate, and troubleshoot Istio Service Mesh
- Loki: Like Prometheus, but for logs
- OpenSearch: Scalable, flexible, and extensible software suite for search, analytics, and observability applications
- OpenTelemetry (OTel): Collection of tools, APIs, and SDKs used to instrument, generate, collect, and export telemetry data
- Prometheus: Monitoring system and time series database
- Zabbix: Single pane of glass view of your whole IT infrastructure stack
🔔 To keep up with future content, follow Gary Stafford on LinkedIn.
This blog represents my viewpoints and not those of my employer, Amazon Web Services (AWS). All product names, logos, and brands are the property of their respective owners.
Kubernetes-based Microservice Observability with Istio Service Mesh: Part 2 of 2
Posted by Gary A. Stafford in AWS, Build Automation, Go, Kubernetes on June 13, 2021
In part two of this two-part post, we will continue to explore the set of popular open-source observability tools that are easily integrated with the Istio service mesh. While these tools are not a part of Istio, they are essential to making the most of Istio’s observability features. The tools include Jaeger and Zipkin for distributed transaction monitoring, Prometheus for metrics collection and alerting, Grafana for metrics querying, visualization, and alerting, and Kiali for overall observability and management of Istio. We will round out the toolset with the addition of Fluent Bit for log processing and aggregation. We will observe a distributed, microservices-based reference application platform deployed to an Amazon Elastic Kubernetes Service (Amazon EKS) cluster using these tools. The platform, running on EKS, will use Amazon DocumentDB as a persistent data store and Amazon MQ to exchange messages.
Observability
The O’Reilly book, Distributed Systems Observability, by Cindy Sridharan, describes The Three Pillars of Observability in Chapter 4: “Logs, metrics, and traces are often known as the three pillars of observability. While plainly having access to logs, metrics, and traces doesn’t necessarily make systems more observable, these are powerful tools that, if understood well, can unlock the ability to build better systems.”
Reference Application Platform
To demonstrate Istio’s observability tools, we deployed a reference application platform to EKS on AWS. I have developed the application platform to demonstrate different Kubernetes platforms, such as EKS, GKE, AKS, and concepts such as service mesh, API management, observability, DevOps, and Chaos Engineering. The platform comprises a backend containing eight Go-based microservices, labeled generically as Service A — Service H, one Angular 12 TypeScript-based frontend UI, four MongoDB databases, and one RabbitMQ message queue. The platform and all its source code are open-sourced on GitHub.

The reference application platform is designed to generate HTTP-based service-to-service, TCP-based service-to-database, and TCP-based service-to-queue-to-service IPC (inter-process communication). For example, Service A calls Service B and Service C; Service B calls Service D and Service E; Service D produces a message to a RabbitMQ queue, which Service F consumes message off on the RabbitMQ queue, and writes to MongoDB, and so on. The platform’s distributed service communications can be observed using Istio’s observability tools when the system is deployed to a Kubernetes cluster running the Istio service mesh.

Part Two
In part one of the post, we configured and deployed the reference application platform to an Amazon EKS development-grade cluster on AWS. The reference application, running on EKS, communicates with two external systems, Amazon DocumentDB (with MongoDB compatibility) and Amazon MQ.

In part two of the post, we will explore each of the observability tools we installed in greater detail. We will understand how each tool contributes to the three pillars of observability: logs, metrics, and traces.
Logs, metrics, and traces are often known as the three pillars of observability.
— Cindy Sridharan
Pillar One: Logs
To paraphrase Jay Kreps on the LinkedIn Engineering Blog, a log is an append-only, totally-ordered sequence of records ordered by time. The ordering of records defines a notion of “time” since entries to the left are defined to be older than entries to the right. Logs are a historical record of events that happened in the past. Logs have been around almost as long as computers and are at the heart of many distributed data systems and real-time application architectures.
Go-based Microservice Logging
An effective logging strategy starts with what you log, when you log, and how you log. As part of our logging strategy, the eight Go-based microservices use Logrus, a popular structured logger for Go first released in 2014. The microservices also implement Banzai Cloud’s logrus-runtime-formatter. There is an excellent article on the formatter, Golang runtime Logrus Formatter. These two logging packages give us greater control over what you log, when you log, and how you log information about our microservices. The recommended configuration of the packages is minimal.
func init() {
 formatter := runtime.Formatter{ChildFormatter: &log.JSONFormatter{}}
 formatter.Line = true
 log.SetFormatter(&formatter)
 log.SetOutput(os.Stdout)
 level, err := log.ParseLevel(logLevel)
 if err != nil {
  log.Error(err)
 }
 log.SetLevel(level)
}
Logrus provides several advantages over Go’s simple logging package, log. For example, log entries are not only for Fatal errors, nor should all verbose log entries be output in a Production environment. The post’s microservices are taking advantage of Logrus’ ability to log at seven levels: Trace, Debug, Info, Warning, Error, Fatal, and Panic. I have also variabilized the log level, allowing it to be easily changed in the Kubernetes Deployment resource at deploy-time.
The microservices also take advantage of Banzai Cloud’s logrus-runtime-formatter. The Banzai formatter automatically tags log messages with runtime and stack information, including function name and line number; extremely helpful when troubleshooting. I am also using Logrus’ JSON formatter.

In 2020, Logus entered maintenance mode. The author, Simon Eskildsen (Principal Engineer at Shopify), stated they will not be introducing new features. This does not mean Logrus is dead. With over 18,000 GitHub Stars, Logrus will continue to be maintained for security, bug fixes, and performance. The author states that many fantastic alternatives to Logus now exist, such as Zerolog, Zap, and Apex.
Client-side Angular UI Logging
Likewise, I have enhanced the logging of the Angular UI using NGX Logger. NGX Logger is a simple logging module for angular (currently supports Angular 6+). It allows “pretty print” to the console and allows log messages to be POSTed to a URL for server-side logging. For this demo, the UI will only log to the web browser’s console. Similar to Logrus, NGX Logger supports multiple log levels: Trace, Debug, Info, Warning, Error, Fatal, and Off. However, instead of just outputting messages, NGX Logger allows us to output properly formatted log entries to the browser’s console.
The level of logs output is configured to be dependent on the environment, Production or not Production. Below is an example of the log output from the Angular UI in Chrome. Since the UI’s Docker Image was built with the Production configuration, the log level is set to INFO. You would not want to expose potentially sensitive information in verbose log output to our end-users in Production.

Controlling logging levels is accomplished by adding the following ternary operator to the app.module.ts file.
imports: [
    BrowserModule,
    HttpClientModule,
    FormsModule,
    LoggerModule.forRoot({
      level: !environment.production ?
        NgxLoggerLevel.DEBUG : NgxLoggerLevel.INFO,
      serverLogLevel: NgxLoggerLevel.INFO
    })
  ],
Platform Logs
Based on the platform built, configured, and deployed in , you now have access logs from multiple sources.
- Amazon DocumentDB: Amazon CloudWatch Audit and Profiler logs;
- Amazon MQ: Amazon CloudWatch logs;
- Amazon EKS: API server, Audit, Authenticator, Controller manager, and Scheduler CloudWatch logs;
- Kubernetes Dashboard: Individual EKS Pod and Replica Set logs;
- Kiali: Individual EKS Pod and Container logs;
- Fluent Bit: EKS performance, host, dataplane, and application CloudWatch logs;
Fluent Bit
According to a recent AWS Blog post, Fluent Bit Integration in CloudWatch Container Insights for EKS, Fluent Bit is an open-source, multi-platform log processor and forwarder that allows you to collect data and logs from different sources and unify and send them to different destinations, including CloudWatch Logs. Fluent Bit is also fully compatible with Docker and Kubernetes environments. Using the newly launched Fluent Bit DaemonSet, you can send container logs from your EKS clusters to CloudWatch logs for logs storage and analytics.
With Fluent Bit, deployed in part one, the EKS cluster’s performance, host, dataplane, and application logs will also be available in Amazon CloudWatch.

Within the application log groups, you have access to the individual log streams for each reference application’s components.

Within each CloudWatch log stream, you can view individual log entries.

CloudWatch Logs Insights enables you to interactively search and analyze your log data in Amazon CloudWatch Logs. You can perform queries to help you more efficiently and effectively respond to operational issues. If an issue occurs, you can use CloudWatch Logs Insights to identify potential causes and validate deployed fixes.

CloudWatch Logs Insights supports CloudWatch Logs Insights query syntax, a query language you can use to perform queries on your log groups. Each query can include one or more query commands separated by Unix-style pipe characters (|). For example:
fields @timestamp, @message
| filter kubernetes.container_name = "service-f"
  and @message like "error"
| sort @timestamp desc
| limit 20
Pillar Two: Metrics
For metrics, we will examine CloudWatch Container Insights, Prometheus, and Grafana. Prometheus and Grafana are industry-leading tools you installed as part of the Istio deployment.
Prometheus
Prometheus is an open-source systems monitoring and alerting toolkit originally built at SoundCloud circa 2012. Prometheus joined the Cloud Native Computing Foundation (CNCF) in 2016 as the second project hosted after Kubernetes.

According to Istio, the Prometheus addon is a Prometheus server that comes preconfigured to scrape Istio endpoints to collect metrics. You can use Prometheus with Istio to record metrics that track the health of Istio and applications within the service mesh. You can visualize metrics using tools like Grafana and Kiali. The Istio Prometheus addon is intended for demonstration only and is not tuned for performance or security.
The istioctl dashboardcommand provides access to all of the Istio web UIs. With the EKS cluster running, Istio installed, and the reference application platform deployed, access Prometheus using the istioctl dashboard prometheus command from your terminal. You must be logged into AWS from your terminal to connect to Prometheus successfully. If you are not logged in to AWS, you will often see the following error: Error: not able to locate <tool_name> pod: Unauthorized. Since we used the non-production demonstration versions of the Istio Addons, there is no authentication and authorization required to access Prometheus.
According to Prometheus, users select and aggregate time-series data in real-time using a functional query language called PromQL (Prometheus Query Language). The result of an expression can either be shown as a graph, viewed as tabular data in Prometheus’s expression browser, or consumed by external systems through Prometheus’ HTTP API. The expression browser includes a drop-down menu with all available metrics as a starting point for building queries. Shown below are a few PromQL examples that were developed as part of writing this post.
istio_agent_go_info{kubernetes_namespace="dev"}
istio_build{kubernetes_namespace="dev"}
up{alpha_eksctl_io_cluster_name="istio-observe-demo", job="kubernetes-nodes"}
sum by (pod) (rate(container_network_transmit_packets_total{stack="reference-app",namespace="dev",pod=~"service-.*"}[5m]))
sum by (instance) (istio_requests_total{source_app="istio-ingressgateway",connection_security_policy="mutual_tls",response_code="200"})
sum by (response_code) (istio_requests_total{source_app="istio-ingressgateway",connection_security_policy="mutual_tls",response_code!~"200|0"})
Prometheus APIs
Prometheus has both an HTTP API and a Management API. There are many useful endpoints in addition to the Prometheus UI, available at http://localhost:9090/graph. For example, the Prometheus HTTP API endpoint that lists all the command-line configuration flags is available at http://localhost:9090/api/v1/status/flags. The endpoint that lists all the available Prometheus metrics is available at http://localhost:9090/api/v1/label/__name__/values; a total of 951 metrics in this demonstration!

The Prometheus endpoint that lists many available metrics with HELP and TYPE to explain their function is found at http://localhost:9090/metrics.

Understanding Metrics
In addition to these endpoints, the standard service level metrics exported by Istio and available via Prometheus are found in the Istio Standard Metrics documentation. An explanation of many of the metrics available via Prometheus are also found in the cAdvisor README on their GitHub site. As mentioned in this AWS Blog Post, the cAdvisor metrics are also available from the command line using the following commands:
export NODE=$(kubectl get nodes | sed -n '2 p') | awk {'print $1'}
kubectl get --raw "/api/v1/nodes/${NODE}/proxy/metrics/cadvisor"
Observing Metrics
Below is an example graph of the backend microservice containers deployed to EKS. The graph PromQL expression returns the amount of working set memory, including recently accessed memory, dirty memory, and kernel memory (container_memory_working_set_bytes), summed by pod, in megabytes (MB). There was no load on the services during the period displayed.
sum by (pod) (container_memory_working_set_bytes{image=~"registry.hub.docker.com/garystafford/.*"}) / (1024^2)

The container_memory_working_set_bytes metric is the same metric used by the kubectl top command (not container_memory_usage_bytes).
> kubectl top pod -n dev --containers=true --use-protocol-buffer
POD                          NAME          CPU(cores)   MEMORY(bytes)
service-a-546fbd558d-28jlm   service-a     1m           6Mi
service-a-546fbd558d-2lcsg   service-a     1m           6Mi
service-b-545c85df9-dl9h8    service-b     1m           6Mi
service-b-545c85df9-q99xm    service-b     1m           5Mi
service-c-58996574-58wd8     service-c     1m           7Mi
service-c-58996574-6q7n4     service-c     1m           7Mi
service-d-867796bb47-87ps5   service-d     1m           6Mi
service-d-867796bb47-fh6wl   service-d     1m           6Mi
...
In another Prometheus example, the PromQL query expression returns the per-second rate of CPU resources measured in CPU units (1 CPU = 1 AWS vCPU), as measured over the last 5 minutes, per time series in the range vector, summed by the pod. During this period, the backend services were under a consistent, simulated load of 25 concurrent users using hey. The four Service D pods were consuming the most CPU units during this time period.
sum by (pod) (rate(container_cpu_usage_seconds_total{image=~"registry.hub.docker.com/garystafford/.*"}[5m])) * 1000

The container_cpu_usage_seconds_total metric is the same metric used by the kubectl top command. The above PromQL expression multiplies the query results by 1,000 to match the results from kubectl top, shown below.
> kubectl top pod -n dev --containers=true --use-protocol-buffer
POD                          NAME          CPU(cores)   MEMORY(bytes)
service-a-546fbd558d-28jlm   service-a     25m          9Mi
service-a-546fbd558d-2lcsg   service-a     27m          8Mi
service-b-545c85df9-dl9h8    service-b     29m          11Mi
service-b-545c85df9-q99xm    service-b     23m          8Mi
service-c-58996574-c8hkn     service-c     62m          9Mi
service-c-58996574-kx895     service-c     55m          8Mi
service-d-867796bb47-87ps5   service-d     285m         12Mi
service-d-867796bb47-9ln7p   service-d     226m         11Mi
...
Limits
Prometheus also exposes container resource limits. For example, the memory limits set on the reference platform’s backend services, displayed in megabytes (MB), using the container_spec_memory_limit_bytes metric. When viewed alongside the real-time resources consumed by the services, these metrics are useful to properly configure and monitor Kubernetes management features such as the Horizontal Pod Autoscaler.
sum by (container) (container_spec_memory_limit_bytes{image=~"registry.hub.docker.com/garystafford/.*"}) / (1024^2) / count by (container) (container_spec_memory_limit_bytes{image=~"registry.hub.docker.com/garystafford/.*"})
Or, memory limits by Pod:
sum by (pod) (container_spec_memory_limit_bytes{image=~"registry.hub.docker.com/garystafford/.*"}) / (1024^2)

Cluster Metrics
Prometheus also contains metrics about Istio components, Kubernetes components, and the EKS cluster. For example, the total memory in gigabytes (GB) of each m5.large EC2 worker nodes in the istio-observe-demo EKS cluster’s managed-ng-1 Managed Node Group.
machine_memory_bytes{alpha_eksctl_io_cluster_name="istio-observe-demo", alpha_eksctl_io_nodegroup_name="managed-ng-1"} / (1024^3)

For total physical cores, use the machine_cpu_physical_core metric, and for vCPU cores use the machine_cpu_cores metric.
Grafana
Grafana describes itself as the leading open-source software for time-series analytics. According to Grafana Labs, Grafana allows you to query, visualize, alert on, and understand your metrics no matter where they are stored. You can easily create, explore, and share visually rich, data-driven dashboards. Grafana also allows users to visually define alert rules for their most important metrics. Grafana will continuously evaluate rules and can send notifications.
If you deployed Grafana using the Istio addons process demonstrated in part one of the post, access Grafana similar to the other tools:
istioctl dashboard grafana

According to Istio, Grafana is an open-source monitoring solution used to configure dashboards for Istio. You can use Grafana to monitor the health of Istio and applications within the service mesh. While you can build your own dashboards, Istio offers a set of preconfigured dashboards for all of the most important metrics for the mesh and the control plane. The preconfigured dashboards use Prometheus as the data source.
- Mesh Dashboard provides an overview of all services in the mesh.
- Service Dashboard provides a detailed breakdown of metrics for a service.
- Workload Dashboard provides a detailed breakdown of metrics for a workload.
- Performance Dashboard monitors the resource usage of the mesh.
- Control Plane Dashboard monitors the health and performance of the control plane.
Below is an example of the Istio Mesh Dashboard, filtered to show the eight backend services workloads running in the dev namespace. During this period, the backend services were under a consistent simulated load of approximately 20 concurrent users using hey. You can observe the p50, p90, and p99 latency of requests to these workloads.

Dashboards are built from Panels, the basic visualization building blocks in Grafana. Each panel has a query editor specific to the data source (Prometheus in this case) selected. The query editor allows you to write your (PromQL) query. Below is the PromQL expression query responsible for the p50 latency Panel displayed in the Istio Mesh Dashboard.
label_join((histogram_quantile(0.50, sum(rate(istio_request_duration_milliseconds_bucket{reporter="source"}[1m])) by (le, destination_workload, destination_workload_namespace)) / 1000) or histogram_quantile(0.50, sum(rate(istio_request_duration_seconds_bucket{reporter="source"}[1m])) by (le, destination_workload, destination_workload_namespace)), "destination_workload_var", ".", "destination_workload", "destination_workload_namespace")
Below is an example of the Outbound Workloads section of the Istio Workload Dashboard. The complete dashboard contains three sections: General, Inbound Workloads, and Outbound Workloads. Here we have filtered the on reference platform’s backend services in the dev namespace.

Here is a different view of the Istio Workload Dashboard, the dashboard’s Inbound Workloads section filtered to a single workload, Service A, the backend’s edge service. Service A accepts incoming traffic from the Istio Ingress Gateway as shown in the dashboard’s panels.

Grafana provides the ability to Explore a Panel. Explore strips away the dashboard and panel options so that you can focus on the query. It helps you iterate until you have a working query and then think about building a dashboard. Below is an example of the Panel showing the egress TCP traffic, based on the istio_tcp_sent_bytes_total metric, for Service F. Service F consumes messages off on the RabbitMQ queue (Amazon MQ) and writes messages to MongoDB (DocumentDB).

You can monitor the resource usage of Istio with the Performance Dashboard.

Additional Dashboards
Grafana provides a site containing official and community-built dashboards, including the above-mentioned Istio dashboards. Importing dashboards into your Grafana instance is as simple as copying the dashboard URL or the ID provided from the Grafana dashboard site and pasting it into the dashboard import option of your Grafana instance. Be aware that not every Kubernetes dashboard in Grafan’s site is compatible with your specific version of Kubernetes, Istio, or EKS, nor relies on Prometheus as a data source. As a result, you might have to test and tweak imported dashboards to get them working.

Below is an example of an imported community dashboard, Kubernetes cluster monitoring (via Prometheus) by Instrumentisto Team (dashboard ID 315).

Alerting
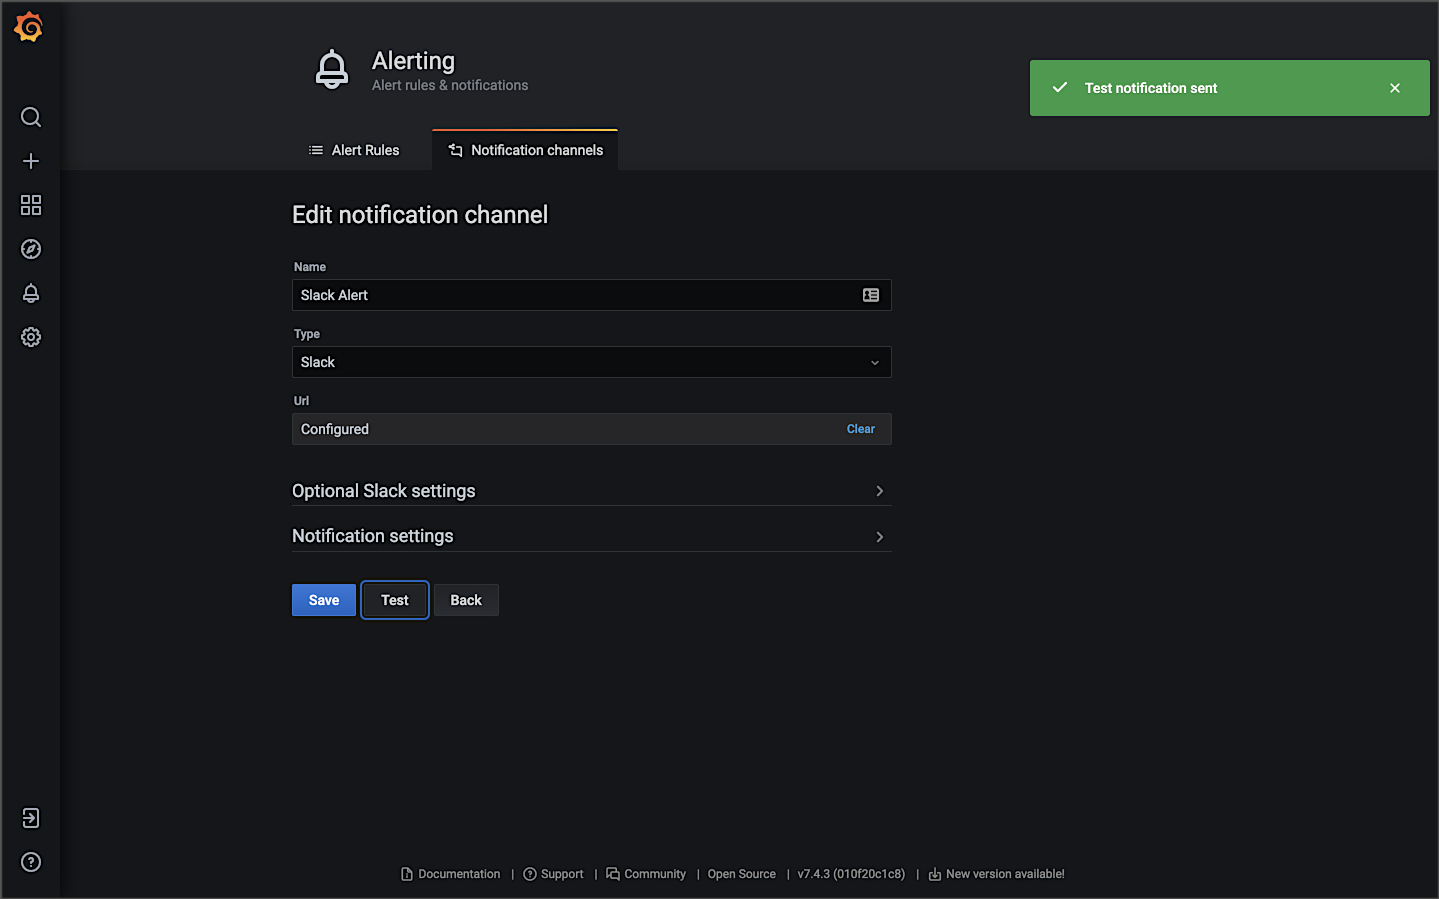
An effective observability strategy must include more than just the ability to visualize results. An effective strategy must also detect anomalies and notify (alert) the appropriate resources or directly resolve incidents. Grafana, like Prometheus, is capable of alerting and notification. You visually define alert rules for your critical metrics. Grafana will continuously evaluate metrics against the rules and send notifications when pre-defined thresholds are breached.
Prometheus supports multiple popular notification channels, including PagerDuty, HipChat, Email, Kafka, and Slack. Below is an example of a Prometheus notification channel that sends alert notifications to a Slack support channel.
Below is an example of an alert based on an arbitrarily high CPU usage of 300 milliCPUs (m). When the CPU usage of a single pod goes above that value for more than 3 minutes, an alert is sent. The high CPU usage could be caused by the Horizontal Pod Autoscaler not functioning, or the HPA has reached its maxReplicas limit, or there are not enough resources available within the cluster to schedule additional pods.

Triggered by the alert, Prometheus sends detailed notifications to the designated Slack channel.

Amazon CloudWatch Container Insights
Lastly in the category of Metrics, Amazon CloudWatch Container Insights collects, aggregates, and summarizes metrics and logs from your containerized applications and microservices. CloudWatch alarms can be set on metrics that Container Insights collects. Container Insights is available for Amazon Elastic Container Service (Amazon ECS) including Fargate, Amazon EKS, and Kubernetes platforms on Amazon EC2.

In Amazon EKS, Container Insights uses a containerized version of the CloudWatch agent to discover all running containers in a cluster. It then collects performance data at every layer of the performance stack. Container Insights collects data as performance log events using the embedded metric format. These performance log events are entries that use a structured JSON schema that enables high-cardinality data to be ingested and stored at scale.
In part one of the post, we also installed CloudWatch Container Insights monitoring for Prometheus, which automates the discovery of Prometheus metrics from containerized systems and workloads.

Below is an example of a basic Performance Monitoring CloudWatch Container Insights Dashboard. The dashboard is filtered to the dev namespace of the EKS cluster, where the reference application platform is running. During this period, the backend services were put under a simulated load using hey. As the load on the application increases, observe the Number of Pods increases from 19 to 34 pods, based on the Deployment resources and HPA configurations. There is also an Alert, shown on the right of the screen. An alarm was triggered for an arbitrarily high level of network transmission activity.

Next is an example of Container Insights’ Container Map view in Memory mode. You see a visual representation of the dev namespace, with each of the backend service’s Service and Deployment resources shown.

There is a warning icon indicating an Alarm on the cluster was triggered.

Lastly, CloudWatch Insights allows you to jump from the CloudWatch Insights to the CloudWatch Log Insights console. CloudWatch Insights will also write the CloudWatch Insights query for you. Below, we went from the Service D container metrics view in the CloudWatch Insights Performance Monitoring console directly to the CloudWatch Log Insights console with a query, ready to run.

Pillar 3: Traces
According to the Open Tracing website, distributed tracing, also called distributed request tracing, is used to profile and monitor applications, especially those built using a microservices architecture. Distributed tracing helps pinpoint where failures occur and what causes poor performance.
According to Istio, header propagation may be accomplished through client libraries, such as Zipkin or Jaeger. It may also be accomplished manually, referred to as trace context propagation, documented in the Distributed Tracing Task. Istio proxies can automatically send spans. Applications need to propagate the appropriate HTTP headers so that when the proxies send span information, the spans can be correlated correctly into a single trace. To accomplish this, an application needs to collect and propagate the following headers from the incoming request to any outgoing requests.
x-request-idx-b3-traceidx-b3-spanidx-b3-parentspanidx-b3-sampledx-b3-flagsx-ot-span-context
The x-b3 headers originated as part of the Zipkin project. The B3 portion of the header is named for the original name of Zipkin, BigBrotherBird. Passing these headers across service calls is known as B3 propagation. According to Zipkin, these attributes are propagated in-process and eventually downstream (often via HTTP headers) to ensure all activity originating from the same root are collected together.
To demonstrate distributed tracing with Jaeger and Zipkin, Service A, Service B, and Service E have been modified to pass the b3 headers. These are the three services that make HTTP requests to other upstream services. The following code has been added to propagate the headers from one service to the next. The Istio sidecar proxy (Envoy) generates the first headers. It is critical to only propagate the headers that are present in the downstream request and have a value, as the code below does. Propagating an empty header will break the distributed tracing.
incomingHeaders := []string{
  "x-b3-flags",
  "x-b3-parentspanid",
  "x-b3-sampled",
  "x-b3-spanid",
  "x-b3-traceid",
  "x-ot-span-context",
  "x-request-id",
 }
for _, header := range incomingHeaders {
  if r.Header.Get(header) != "" {
   req.Header.Add(header, r.Header.Get(header))
  }
 }
Below, the highlighted section of the response payload from a call to Service A’s /api/request-echo endpoint reveals the b3 headers originating from the Istio proxy and passed to Service A.

Jaeger
According to their website, Jaeger, inspired by Dapper and OpenZipkin, is a distributed tracing system released as open source by Uber Technologies. Jaeger is used for monitoring and troubleshooting microservices-based distributed systems, including distributed context propagation, distributed transaction monitoring, root cause analysis, service dependency analysis, and performance and latency optimization. The Jaeger website contains a helpful overview of Jaeger’s architecture and general tracing-related terminology.
If you deployed Jaeger using the Istio addons process demonstrated in part one of the post, access Jaeger similar to the other tools:
istioctl dashboard jaeger
Below is an example of the Jaeger UI’s Search view, displaying the results of a search for the Istio Ingress Gateway service over a period of time. We see a timeline of traces across the top with a list of trace results below. As discussed on the Jaeger website, a trace is composed of spans. A span represents a logical unit of work in Jaeger that has an operation name. A trace is an execution path through the system and can be thought of as a directed acyclic graph (DAG) of spans. If you have worked with systems like Apache Spark, you are probably already familiar with the concept of DAGs.

Below is a detailed view of a single trace in Jaeger’s Trace Timeline mode. The 14 spans encompass eight of the reference platform’s components: seven of the eight backend services and the Istio Ingress Gateway. The spans each have individual timings, with an overall trace time of 160 ms. The root span in the trace is the Istio Ingress Gateway. The Angular UI, loaded in the end user’s web browser, calls Service A via the Istio Ingress Gateway. From there, we see the expected flow of our service-to-service IPC. Service A calls Services B and Service C. Service B calls Service E, which calls Service G and Service H.
In this demonstration, traces are not instrumented to span the RabbitMQ message queue nor MongoDB. This means you would not see a trace that includes a call from Service D to Service F via the RabbitMQ.

The visualization of the trace’s timeline demonstrates the synchronous nature of the reference platform’s service-to-service IPC instead of the asynchronous nature of the decoupled communications using the RabbitMQ messaging queue. Note how Service A waits for each service in its call chain to respond before returning its response to the requester.
Within Jaeger’s Trace Timeline view, you have the ability to drill into a single span, which contains additional metadata. The span’s metadata includes the API endpoint URL being called, HTTP method, response status, and several other headers.

Jaeger also has an experimental Trace Graph mode, which displays a graph view of the same trace.

Jaeger also includes a Compare Trace feature and two Dependencies views: Force-Directed Graph and DAG. I find both views rather primitive compared to Kiali. Lacking access to Kiali, the views are marginally useful as a dependency graph.

Zipkin
Zipkin is a distributed tracing system, which helps gather timing data needed to troubleshoot latency problems in service architectures. According to a 2012 post on Twitter’s Engineering Blog, Zipkin started as a project during Twitter’s first Hack Week. During that week, they implemented a basic version of the Google Dapper paper for Thrift.
Zipkin and Jaeger are very similar in terms of capabilities. I have chosen to focus on Jaeger in this post as I prefer it over Zipkin. If you want to try Zipkin instead of Jaeger, you can use the following commands to remove Jaeger and install Zipkin from the Istio addons extras directory. In part one of the post, we did not install Zipkin by default when we deployed the Istio addons. Be aware that running both tools at the same time in the same Kubernetes cluster will cause unpredictable tracing results.
kubectl delete -f https://raw.githubusercontent.com/istio/istio/release-1.10/samples/addons/jaeger.yaml
kubectl apply -f https://raw.githubusercontent.com/istio/istio/release-1.10/samples/addons/extras/zipkin.yaml
Access Zipkin similar to the other observability tools:
istioctl dashboard zipkin
Below is an example of a distributed trace visualized in Zipkin’s UI, containing 14 spans. This is very similar to the trace visualized in Jaeger, shown above. The spans encompass eight of the reference platform’s components: seven of the eight backend services and the Istio Ingress Gateway. The spans each have individual timings, with an overall trace time of 154 ms.

Zipkin can also visualize a dependency graph based on the distributed trace. Below is an example of a traffic simulation over a two-minute period, showing network traffic flowing between the reference platform’s components, illustrated as a dependency graph.

Kiali: Microservice Observability
According to their website, Kiali is a management console for an Istio-based service mesh. It provides dashboards, observability, and lets you operate your mesh with robust configuration and validation capabilities. It shows the structure of a service mesh by inferring traffic topology and displaying the mesh’s health. Kiali provides detailed metrics, powerful validation, Grafana access, and strong integration for distributed tracing with Jaeger.
If you deployed Kaili using the Istio addons process demonstrated in part one of the post, access Kiali similar to the other tools:
istioctl dashboard kaili
For improved security, I optionally chose to install the latest version of Kaili using the customizable install mentioned in Istio’s documentation. Using Kiali’s Install via Kiali Server Helm Chart option adds token-based authentication, similar to the Kubernetes Dashboard.

Logging into Kiali, we see the Overview tab, which provides a global view of all namespaces within the Istio service mesh and the number of applications within each namespace.

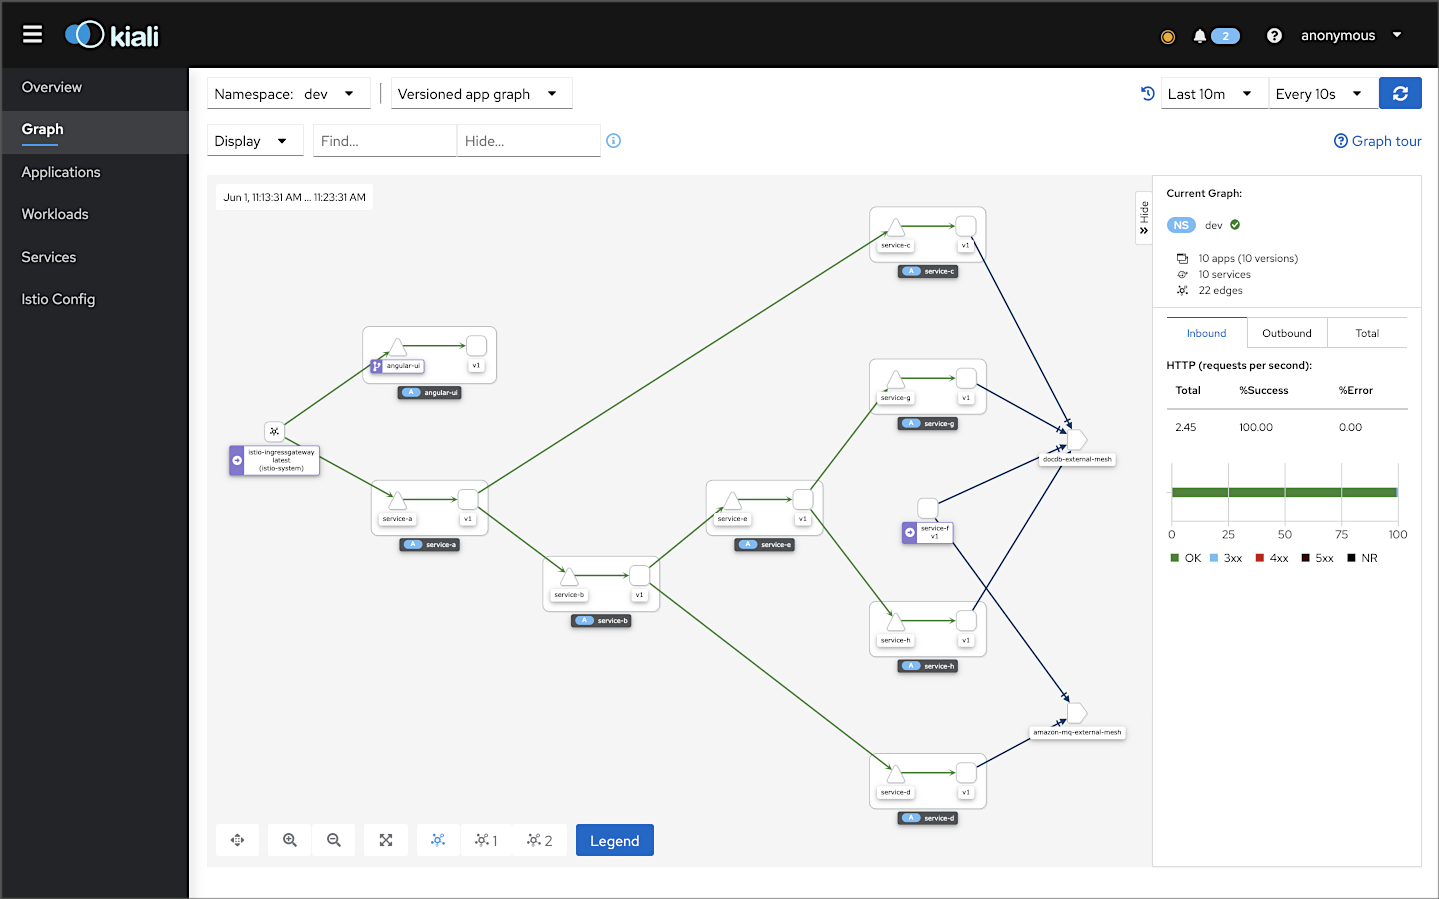
The Graph tab in the Kiali UI represents the components running in the Istio service mesh. Below, filtering on the cluster’s dev Namespace, we can observe that Kiali has mapped 8 applications (Workloads), 10 services, and 22 edges (a graph term). Specifically, we see the Istio Ingres Proxy at the edge of the service mesh, the Angular UI and eight backend services all with their respective Envoy proxy sidecars that are taking traffic (Service F did not take any direct traffic from another service in this example), the external DocumentDB egress point, and the external Amazon MQ egress point. Finally, note how service-to-service traffic flows, with Istio, from the service to its sidecar proxy, to the other service’s sidecar proxy, and finally to the service.

Below is a similar view of the service mesh, but this time, there are failures between the Istio Ingress Gateway and Service A, shown in red. We can also observe overall metrics for the HTTP traffic, such as the request per second inbound and outbound, total requests, success and error rates, and HTTP status codes.

Kiali allows you to zoom in and focus on a single component in the graph and its individual metrics.

Kiali can also display average request times and other metrics for each edge in the graph (communication between two components). Kaili can even show those metrics over a given period of time, using Kiali’s Replay feature, shown below.

Focusing on the external DocumentDB cluster, Kiali also allows us to view TCP traffic between the four services within the service mesh that connect to the external cluster.

The Applications tab lists all the applications, their namespace, and labels.

You can drill into an individual component on both the Applications and Workloads tabs and view additional details. Details include the overall health, Pods, and Istio Config status. Below is an overview of the Service A workload in the dev Namespace.

The Workloads detailed view also includes inbound and outbound metrics. Below is an example of the outbound request volume, duration, throughput, and size metrics, for Service A in the dev Namespace.

Kiali also gives you access to the individual pod’s container logs. Although log access is not as user-friendly as other log sources discussed previously, having logs available alongside metrics (integration with Grafana), traces (integration with Jaeger), and mesh visualization, all in Kiali, can be very effective as a single source for observability.

Kiali also has an Istio Config tab. The Istio Config tab displays a list of all of the available Istio configuration objects that exist in the user’s environment.

You can use Kiali to configure and manage the Istio service mesh and its installed resources. Using Kiali, you can actually modify the deployed resources, similar to using the kubectl edit command.

Oftentimes, I find Kiali to be my first stop when troubleshooting platform issues. Once I identify the specific components or communication paths having issues, I can query the CloudWatch logs and Prometheus metrics through the Grafana dashboard.
Conclusion
In this two-part post, we explored a set of popular open-source observability tools, easily integrated with the Istio service mesh. These tools included Jaeger and Zipkin for distributed transaction monitoring, Prometheus for metrics collection and alerting, Grafana for metrics querying, visualization, and alerting, and Kiali for overall observability and management of Istio. We rounded out the toolset with the addition of Fluent Bit for log processing and forwarding to Amazon CloudWatch Container Insights. Using these tools, we successfully observed a microservices-based, distributed reference application platform deployed to Amazon EKS.
This blog represents my own viewpoints and not of my employer, Amazon Web Services (AWS). All product names, logos, and brands are the property of their respective owners.
Kubernetes-based Microservice Observability with Istio Service Mesh: Part 1 of 2
Posted by Gary A. Stafford in AWS, DevOps, Go, JavaScript, Kubernetes on June 3, 2021
This two-part post explores a set of popular open-source observability tools that are easily integrated with the Istio service mesh. While these tools are not a part of Istio, they are essential to making the most of Istio’s observability features. The tools include Jaeger and Zipkin for distributed transaction monitoring, Prometheus for metrics collection and alerting, Grafana for metrics querying, visualization, and alerting, and Kiali for overall observability and management of Istio. We will round out the toolset with the addition of Fluent Bit for log processing and aggregation. We will observe a distributed, microservices-based reference application platform deployed to an Amazon Elastic Kubernetes Service (Amazon EKS) cluster using these tools. The platform, running on EKS, will use Amazon DocumentDB as a persistent data store and Amazon MQ to exchange messages.
Observability
Similar to quantum computing, big data, artificial intelligence, machine learning, and 5G, observability is currently a hot buzzword in the IT industry. According to Wikipedia, observability is a measure of how well the internal states of a system can be inferred from its external outputs. The O’Reilly book, Distributed Systems Observability, by Cindy Sridharan, describes The Three Pillars of Observability in Chapter 4: “Logs, metrics, and traces are often known as the three pillars of observability. While plainly having access to logs, metrics, and traces doesn’t necessarily make systems more observable, these are powerful tools that, if understood well, can unlock the ability to build better systems.”
Logs, metrics, and traces are often known as the three pillars of observability.
Cindy Sridharan
Honeycomb is a developer of observability tools for production systems. The honeycomb.io site includes articles, blog posts, whitepapers, and podcasts on observability. According to Honeycomb, “Observability is achieved when a system is understandable — which is difficult with complex systems, where most problems are the convergence of many things failing at once.”
As modern distributed systems grow ever more complex, the ability to observe those systems demands equally modern tooling designed with this level of complexity in mind. Traditional logging and monitoring tools struggle with today’s polyglot, distributed, event-driven, ephemeral, containerized and serverless application environments. Tools like the Istio service mesh attempt to solve the observability challenge by offering easy integration with several popular open-source telemetry tools. Istio’s integrations include Jaeger for distributed tracing, Kiali for Istio service mesh-based microservice visualization, and Prometheus and Grafana for metric collection, monitoring, and alerting. Combined with cloud-native monitoring and logging tools such as Fluent Bit and Amazon CloudWatch Container Insights, we have a complete observability platform for modern distributed applications running on Amazon Elastic Kubernetes Service (Amazon EKS).
Traditional logging and monitoring tools struggle with today’s polyglot, distributed, event-driven, ephemeral, containerized and serverless application environments.
Gary Stafford
Reference Application Platform
To demonstrate Istio’s observability tools, we will deploy a reference application platform, written in Go and TypeScript with Angular, to EKS on AWS. The reference application platform was developed to demonstrate different Kubernetes platforms, such as EKS, GKE, and AKS, and concepts such as service mesh, API management, observability, DevOps, and Chaos Engineering. The platform is currently comprised of a backend containing eight Go-based microservices, labeled generically as Service A — Service H, one Angular 12 TypeScript-based frontend UI, four MongoDB databases, and one RabbitMQ message queue for event-based communications. The platform and all its source code are open-sourced on GitHub.
The reference application platform is designed to generate HTTP-based service-to-service, TCP-based service-to-database, and TCP-based service-to-queue-to-service IPC (inter-process communication). Service A calls Service B and Service C; Service B calls Service D and Service E; Service D produces a message on a RabbitMQ queue, which Service F consumes and writes to MongoDB, and so on. Distributed service communications can be observed using Istio’s observability tools when the system is deployed to a Kubernetes cluster running the Istio service mesh.
Service Responses
Each Go microservice contains a /greeting, /health, and /metrics endpoint. The service’s /health endpoint is used to configure Kubernetes Liveness, Readiness, and Startup Probes. The /metrics endpoint exposes metrics that Prometheus scraps. Lastly, upstream services respond to requests from downstream services when calling their /greeting endpoint by returning a small informational JSON payload — a greeting.
{
    "id": "1f077127-2f9f-4a90-ad88-da52327c2620",
    "service": "Service C",
    "message": "Konnichiwa (こんにちは), from Service C!",
    "created": "2021-06-04T04:34:02.901726709Z",
    "hostname": "service-c-6d5cc8fdfd-stsq9"
}
The responses are aggregated across the service call chain, resulting in an array of service responses being returned to the edge service, Service A, and subsequently, the platform’s UI running in the end user’s web browser.
[
    {
        "id": "a9afab6a-3e2a-41a6-aec7-7257d2904076",
        "service": "Service D",
        "message": "Shalom (שָׁלוֹם), from Service D!",
        "created": "2021-06-04T14:28:32.695151047Z",
        "hostname": "service-d-565c775894-vdsjx"
    },
    {
        "id": "6d4cc38a-b069-482c-ace5-65f0c2d82713",
        "service": "Service G",
        "message": "Ahlan (أهلا), from Service G!",
        "created": "2021-06-04T14:28:32.814550521Z",
        "hostname": "service-g-5b846ff479-znpcb"
    },
    {
        "id": "988757e3-29d2-4f53-87bf-e4ff6fbbb105",
        "service": "Service H",
        "message": "Nǐ hǎo (你好), from Service H!",
        "created": "2021-06-04T14:28:32.947406463Z",
        "hostname": "service-h-76cb7c8d66-lkr26"
    },
    {
        "id": "966b0bfa-0b63-4e21-96a1-22a76e78f9cd",
        "service": "Service E",
        "message": "Bonjour, from Service E!",
        "created": "2021-06-04T14:28:33.007881464Z",
        "hostname": "service-e-594d4754fc-pr7tc"
    },
    {
        "id": "c612a228-704f-4562-90c5-33357b12ff8d",
        "service": "Service B",
        "message": "Namasté (नमस्ते), from Service B!",
        "created": "2021-06-04T14:28:33.015985983Z",
        "hostname": "service-b-697b78cf54-4lk8s"
    },
    {
        "id": "b621bd8a-02ee-4f9b-ac1a-7d91ddad85f5",
        "service": "Service C",
        "message": "Konnichiwa (こんにちは), from Service C!",
        "created": "2021-06-04T14:28:33.042001406Z",
        "hostname": "service-c-7fd4dd5947-5wcgs"
    },
    {
        "id": "52eac1fa-4d0c-42b4-984b-b65e70afd98a",
        "service": "Service A",
        "message": "Hello, from Service A!",
        "created": "2021-06-04T14:28:33.093380628Z",
        "hostname": "service-a-6f776d798f-5l5dz"
    }
]
CORS
The platform’s backend edge service, Service A, is configured for Cross-Origin Resource Sharing (CORS) using the access-control-allow-origin response header. The CORS configuration allows the Angular UI, running in the end user’s web browser, to call Service A’s /greeting endpoint, which potentially resides in a different host from the UI. Shown below is the Go source code for Service A. Note the use of the ALLOWED_ORIGINS environment variable on lines 32 and 195, which allows you to configure the origins that are allowed from the service’s Deployment resource.
MongoDB- and RabbitMQ-as-a-Service
Using external services will help us understand how Istio and its observability tools collect telemetry for communications between the reference application platform on Kubernetes and external systems.
Amazon DocumentDB
For this demonstration, the reference application platform’s MongoDB databases will be hosted, external to EKS, on Amazon DocumentDB (with MongoDB compatibility). According to AWS, Amazon DocumentDB is a purpose-built database service for JSON data management at scale, fully managed and integrated with AWS, and enterprise-ready with high durability.
Amazon MQ
Similarly, the reference application platform’s RabbitMQ queue will be hosted, external to EKS, on Amazon MQ. AWS MQ is a managed message broker service for Apache ActiveMQ and RabbitMQ, making it easy to set up and operate message brokers on AWS. Amazon MQ reduces your operational responsibilities by managing the provisioning, setup, and maintenance of message brokers for you. For RabbitMQ, Amazon MQ provides access to the RabbitMQ web console. The console allows us to monitor and manage RabbitMQ.

Shown below is the Go source code for Service F. This service consumes messages from the RabbitMQ queue, placed there by Service D, and writes the messages to MongoDB. Services use Sean Treadway’s Go RabbitMQ Client Library and MongoDB’s MongoDB Go Driver for connectivity.
Source Code
All source code for this post is available on GitHub within two projects. Go-based microservices source code and Kubernetes resources are located in the k8s-istio-observe-backend project repository. The Angular UI TypeScript-based source code is located in the k8s-istio-observe-frontend project repository. You do not need to clone the Angular UI project for this demonstration. The demonstration uses the 2021-istio branch for both projects.
git clone --branch 2021-istio --single-branch \
  https://github.com/garystafford/k8s-istio-observe-backend.git
# optional - not needed for demonstration
git clone --branch 2021-istio --single-branch \
  https://github.com/garystafford/k8s-istio-observe-frontend.git
Docker images referenced in the Kubernetes Deployment resource files for the Go services and UI are all available on Docker Hub. The Go microservice Docker images were built using the official Golang Alpine image on DockerHub, containing Go version 1.16.4. Using the Alpine image to compile the Go source code ensures the containers will be as small as possible and minimize the container’s potential attack surface.
Prerequisites
This post will assume a basic level of knowledge of AWS EKS, Kubernetes, and Istio. Furthermore, the post assumes you have already installed recent versions of the AWS CLI v2, kubectl, Weaveworks’ eksctl, Docker, and Istio. Meaning that the aws, kubectl, eksctl, istioctl, and docker command tools are all available from the terminal.

CLI for Amazon EKS
Weaveworks’ eksctl is a simple CLI tool for creating and managing clusters on EKS — Amazon’s managed Kubernetes service for EC2. It is written in Go and uses CloudFormation.
CLI for Istio
The Istio configuration command-line utility, istioctl, is designed to help debug and diagnose the Istio mesh.
Set-up and Installation
To deploy the microservices platform to EKS, we will proceed in roughly the following order:
- Create a TLS certificate and Route53 hosted zone records for ALB;
- Create an Amazon DocumentDB database cluster;
- Create an Amazon MQ RabbitMQ message broker;
- Create an EKS cluster;
- Modify Kubernetes resources for your own environment;
- Deploy AWS Application Load Balancer (ALB) and associated resources;
- Deploy Istio to the EKS cluster;
- Deploy Fluent Bit to the EKS cluster;
- Deploy the reference platform to EKS;
- Test and troubleshoot the platform;
- Observe the results in part two;
Amazon DocumentDB
As previously mentioned, the MongoDB databases will be hosted, external to EKS, on Amazon DocumentDB, with MongoDB compatibility. Create a DocumentDB cluster. For the sake of simplicity and affordability of the demo, I recommend creating a single db.r5.large node cluster. We will connect from the microservices to Amazon DocumentDB using the supplied mongodb:// connection string.
Amazon DocumentDB clusters are deployed within an Amazon Virtual Private Cloud (Amazon VPC). If you are installing DocumentDB in a separate VPC than EKS, you will need to ensure that the EKS VPC can access the DocumentDB VPC. Per the DocumentDB documentation, DocumentDB clusters can be accessed directly by Amazon EC2 instances or other AWS services that are deployed in the same Amazon VPC. Additionally, Amazon DocumentDB can be accessed via EC2 instances or other AWS services from different VPCs in the same AWS Region or other Regions via VPC peering.

Amazon MQ
Similarly, the RabbitMQ queues will be hosted, external to EKS, on Amazon MQ. Create an Amazon MQ RabbitMQ broker. To ensure the simplicity and affordability of the demo, I recommend a single mq.m5.large instance broker. The broker is running the RabbitMQ engine and has TLS disabled. We will connect from the microservices to Amazon MQ using AMQP (Advanced Message Queuing Protocol). Amazon MQ provides an amqps:// endpoint. The amqps URI scheme is used to instruct a client to make a secure connection to the server. You can manage and observe RabbitMQ from the RabbitMQ web console provided by Amazon MQ.

Modify Kubernetes Resources
You will need to change several configuration settings in the GitHub project’s Kubernetes resource files to match your environment.
Istio ServiceEntry for Document DB
Modify the Istio ServiceEntry resource, external-mesh-document-db.yaml, adding your DocumentDB host address. This file allows egress traffic from the microservices on EKS to the DocumentDB cluster.
apiVersion: networking.istio.io/v1alpha3
kind: ServiceEntry
metadata:
  name: docdb-external-mesh
spec:
  hosts:
  - {{ your_document_db_hostname }}
  ports:
  - name: mongo
    number: 27017
    protocol: MONGO
  location: MESH_EXTERNAL
  resolution: NONE
Istio ServiceEntry for Amazon MQ
Modify the Istio ServiceEntry resource, external-mesh-amazon-mq.yaml, adding your Amazon MQ host address. This file allows egress traffic from the microservices on EKS to the Amazon MQ RabbitMQ broker.
apiVersion: networking.istio.io/v1alpha3
kind: ServiceEntry
metadata:
  name: amazon-mq-external-mesh
spec:
  hosts:
    - {{ your_amazon_mq_hostname }}
  ports:
  - name: rabbitmq
    number: 5671
    protocol: TCP
  location: MESH_EXTERNAL
  resolution: NONE
Istio Gateway
There are numerous strategies you can use to route traffic into the EKS cluster via Istio. For this demonstration, I am using an AWS Application Load Balancer (ALB). I have mapped one hostname, observe-ui.example-api.com, to the Angular UI application running on EKS. The backend microservice-based API, specifically the edge service, Service A, is mapped to a second hostname, observe-api.example-api.com.

According to Istio, the Gateway describes a load balancer operating at the edge of the mesh, receiving incoming or outgoing HTTP/TCP connections. Modify the Istio Ingress Gateway resource, gateway.yaml. Insert your own DNS entries into the hosts section. These are the only hosts that will be allowed into the mesh on port 80.
apiVersion: networking.istio.io/v1beta1
kind: Gateway
metadata:
  name: istio-gateway
spec:
  selector:
    istio: ingressgateway # use istio default controller
  servers:
    - port:
        number: 80
        name: ui
        protocol: HTTP
      hosts:
        - {{ your_ui_hostname }}
        - {{ your_api_hostname }}
Istio VirtualService
According to Istio, a VirtualService defines a set of traffic routing rules to apply when a host is addressed. A VirtualService is bound to a Gateway to control the forwarding of traffic arriving at a particular host and port. Modify the project’s two Istio VirtualServices resources, virtualservices.yaml. Insert the corresponding DNS entries from the Istio Gateway.
---
apiVersion: networking.istio.io/v1beta1
kind: VirtualService
metadata:
  name: angular-ui
spec:
  hosts:
    - {{ your_ui_hostname }}
  gateways:
    - istio-gateway
  http:
    - match:
        - uri:
            prefix: /
      route:
        - destination:
            host: angular-ui.dev.svc.cluster.local
            subset: v1
            port:
              number: 80
---
apiVersion: networking.istio.io/v1beta1
kind: VirtualService
metadata:
  name: service-a
spec:
  hosts:
    - {{ your_api_hostname }}
  gateways:
    - istio-gateway
  http:
    - match:
        - uri:
            prefix: /api
      route:
        - destination:
            host: service-a.dev.svc.cluster.local
            subset: v1
            port:
              number: 8080
Kubernetes Secret
According to the Kubernetes project, Kubernetes Secrets lets you store and manage sensitive information, such as passwords, OAuth tokens, and SSH keys. Storing confidential information in a Secret is safer and more flexible than putting it verbatim in a Pod definition or in a container image.
The project contains a Kubernetes Opaque type Secret resource, go-srv-demo.yaml. The Secret contains several pieces of arbitrary user-defined data we want to secure. Data includes the full DocumentDB mongodb:// connection string and the Amazon MQ amqps:// connection string used by the microservices. We will use the Secret to secure the entire connection string, including the hostname, port, username, and password. The data also includes the DocumentDB host, username, and password, and an arbitrary username and password to login to Mongo Express using Basic Authentication.
You must encode your secret’s values using base64. On Linux and Mac, you can use the base64 program to encode the connection strings.
echo -n '{{ your_secret_to_encode }}' | base64
# e.g., echo -n 'amqps://username:password@hostname.mq.us-east-1.amazonaws.com:5671/' | base64
Add the base64 encoded values to the Secret resource.
apiVersion: v1
kind: Secret
metadata:
  name: go-srv-config
  namespace: dev
type: Opaque
data:
  mongodb.conn: {{ your_base64_encoded_secret }}
  rabbitmq.conn: {{ your_base64_encoded_secret }}
---
apiVersion: v1
kind: Secret
metadata:
  name: mongo-express-config
  namespace: mongo-express
type: Opaque
data:
  me.basicauth.username: {{ your_base64_encoded_secret }}
  me.basicauth.password: {{ your_base64_encoded_secret }}
  mongodb.host: {{ your_base64_encoded_secret }}
  mongodb.username: {{ your_base64_encoded_secret }}
  mongodb.password: {{ your_base64_encoded_secret }}
AWS Load Balancer Controller
The project contains a Custom Resource Definition (CRD) and associated resources, aws-load-balancer-controller-v220-all.yaml. These resources configure the AWS Application Load Balancer (ALB) using the AWS Load Balancer Controller v2.2.0, aws-load-balancer-controller. The AWS Load Balancer Controller manages AWS Elastic Load Balancers (ELB) for a Kubernetes cluster. The controller provisions an AWS ALB when you create a Kubernetes Ingress.
Modify line 797 to include the name of your own cluster. I am using the cluster name istio-observe-demo throughout the demo.
spec:
      containers:
      - args:
        - --cluster-name=istio-observe-demo
        - --ingress-class=alb
        image: amazon/aws-alb-ingress-controller:v2.2.0
        livenessProbe:
          failureThreshold: 2
          httpGet:
            path: /healthz
            port: 61779
            scheme: HTTP
EKS Cluster Config
The project contains an eksctl ClusterConfig resource, cluster.yaml. The ClusterConfig defines the configuration of the Amazon EKS cluster along with networking, security, and other associated resources. Instead of a pre-existing Amazon Virtual Private Cloud (Amazon VPC) for this demo, eksctl will create a VPC and associated AWS resources as part of cluster creation. Modify the file to match your AWS Region, desired EKS cluster name, and Kubernetes release. For the demo, I am using the latest Kubernetes 1.20 release.
apiVersion: eksctl.io/v1alpha5
kind: ClusterConfig
metadata:
  name: istio-observe-demo
  region: us-east-1
  version: "1.20"
iam:
  withOIDC: true
Set Environment Variables
Modify and set the following environment variables in your terminal. I will be using us-east-1 for all the demonstration’s AWS resources that are part of the demonstration. They should match the eksctl ClusterConfig resource above.
export AWS_ACCOUNT=$(aws sts get-caller-identity --output text --query 'Account')
export EKS_REGION="us-east-1"
export CLUSTER_NAME="istio-observe-demo"
Istio Home
Set your ISTIO_HOME directory. I have the latest Istio 1.10.0 installed and have theISTIO_HOME environment variable set in my Oh My Zsh .zshrc file. I have also set Istio’s bin/ subdirectory in my PATH environment variable. The bin/ subdirectory contains the istioctl executable.
echo $ISTIO_HOME
/Applications/Istio/istio-1.10.0
where istioctl
/Applications/Istio/istio-1.10.0/bin/istioctl
istioctl version

client version: 1.10.0
control plane version: 1.10.0
data plane version: 1.10.0 (4 proxies)
Create EKS Cluster
With the cluster.yaml file modified previously, deploy the EKS cluster to a new VPC on AWS.
eksctl create cluster -f ./resources/other/cluster.yaml
This step deploys a large number of resources using CloudFormation. The complete EKS provisioning process can take up to 15–20 minutes to complete.

For the complete demonstration, eksctl will deploy a total of four CloudFormation stacks to your AWS environment.

Once complete, configure kubectl so that you can connect to an Amazon EKS cluster.
aws eks --region ${EKS_REGION} update-kubeconfig \
    --name ${CLUSTER_NAME}
Confirm that your cluster creation was successful with the following commands:
kubectl cluster-info
eksctl utils describe-stacks \
  --region ${EKS_REGION} --cluster ${CLUSTER_NAME}

Use the EKS Management Console to review the new cluster’s details.

The EKS cluster in this demonstration was created with a single Amazon EKS managed node group, managed-ng-1. The managed node group contains three m5.large EC2 instances. The composition of the EKS cluster can be modified in the eksctl ClusterConfig resource, cluster.yaml.

Deploy AWS Load Balancer Controller
Using the aws-load-balancer-controller-v220-all.yaml file you previously modified, deploy the AWS Load Balancer Controller v2.2.0. Please carefully review the AWS Load Balancer Controller instructions to understand how this resource is configured and integrated with EKS.
curl -o resources/aws/iam-policy.json \
  https://raw.githubusercontent.com/kubernetes-sigs/aws-load-balancer-controller/v2.2.0/docs/install/iam_policy.json
aws iam create-policy \
    --policy-name AWSLoadBalancerControllerIAMPolicy220 \
    --policy-document file://resources/aws/iam-policy.json

eksctl create iamserviceaccount \
  --region ${EKS_REGION} \
  --cluster ${CLUSTER_NAME} \
  --namespace=kube-system \
  --name=aws-load-balancer-controller \
  --attach-policy-arn=arn:aws:iam::${AWS_ACCOUNT}:policy/AWSLoadBalancerControllerIAMPolicy220 \
  --override-existing-serviceaccounts \
  --approve
kubectl apply --validate=false \
  -f https://github.com/jetstack/cert-manager/releases/download/v1.3.1/cert-manager.yaml

kubectl apply -f resources/other/aws-load-balancer-controller-v220-all.yaml
To confirm the aws-load-balancer-controller is deployed and ready, run the following command:
kubectl get deployment -n kube-system aws-load-balancer-controller
NAME                           READY   UP-TO-DATE   AVAILABLE   AGE
aws-load-balancer-controller   1/1     1            1           55s
AWS Load Balancer Controller Policy
There is an OpenID Connect provider URL associated with the EKS cluster. To use IAM roles for service accounts, an IAM OIDC provider must exist for your cluster. Obtain the URL from the EKS Management Console’s Details tab.

You can also obtain the URL using the following AWS CLI commands:
aws eks describe-cluster --name ${CLUSTER_NAME}
aws iam list-open-id-connect-providers
The project contains a policy document, trust-eks-policy.json. Modify the policy document by adding the OpenID Connect information found above. Instructions are also included in the AWS Create an IAM OIDC provider for your cluster documentation.
{
   "Version":"2012-10-17",
   "Statement":[
      {
         "Effect":"Allow",
         "Principal":{
            "Federated":" {{ your_openid_connect_arn }}"
         },
         "Action":"sts:AssumeRoleWithWebIdentity",
         "Condition":{
            "StringEquals":{
               "oidc.eks.us-east-1.amazonaws.com/id/{{ your_open_id_connect_id }}:sub":"system:serviceaccount:kube-system:alb-ingress-controller"
            }
         }
      }
   ]
}
Create and attach the AWS Load Balancer Controller IAM policies and roles.
aws iam create-role \
  --role-name eks-alb-ingress-controller-eks-istio-observe-demo \
  --assume-role-policy-document file://resources/aws/trust-eks-policy.json

aws iam attach-role-policy \
  --role-name eks-alb-ingress-controller-eks-istio-observe-demo \
  --policy-arn="arn:aws:iam::${AWS_ACCOUNT}:policy/AWSLoadBalancerControllerIAMPolicy220"

aws iam attach-role-policy \
  --role-name eks-alb-ingress-controller-eks-istio-observe-demo \
  --policy-arn arn:aws:iam::aws:policy/AmazonEKSWorkerNodePolicy

aws iam attach-role-policy \
  --role-name eks-alb-ingress-controller-eks-istio-observe-demo \
  --policy-arn arn:aws:iam::aws:policy/AmazonEKS_CNI_Policy
Create Namespaces
Kubernetes supports multiple virtual clusters backed by the same physical cluster. These virtual clusters are called namespaces. The dev namespace will house the reference application platform for this demonstration — the Angular UI frontend and Go microservices backend. This namespace represents a development environment on EKS for our reference application platform. A second namespace, mongo-express, will be used to deploy Mongo Express later in the post.
kubectl apply -f ./minikube/resources/namespaces.yaml
Enable Automatic Sidecar Injection
To take advantage of Istio’s features, pods in the mesh must be running an Istio sidecar proxy. By setting the istio-injection=enabled label on a namespace and the injection webhook is enabled, any new pods created in that namespace will automatically have an Istio sidecar proxy added to them. Labeling the dev namespace for automatic sidecar injection ensures that our reference application platform — the UI and the microservices — will have Istio sidecar proxy automatically injected into their pods.
kubectl label namespace dev istio-injection=enabled
Deploy Secret Resources
Create the DocumentDB and Amazon MQ Secrets in the appropriate dev and mongo-express namespaces.
kubectl apply -f ./resources/secrets/secrets.yaml
Install Istio Configuration Profile
Istio comes with several built-in configuration profiles. The profiles provide customization of the Istio control plane and the sidecars for the Istio data plane.
istioctl profile list
Istio configuration profiles:
  default
  demo
  empty
  external
  minimal
  openshift
  preview
  remote
For this demonstration, use the default profile, which installs Istio core, istiod, istio-ingressgateway, and istio-egressgateway.
istioctl install --set profile=demo -y
✔ Istio core installed
✔ Istiod installed
✔ Ingress gateways installed
✔ Egress gateways installed
✔ Installation complete
Deploy Istio Gateway, VirtualService, and DestinationRule Resources
An Istio Gateway describes a load balancer operating at the edge of the mesh receiving incoming or outgoing HTTP/TCP connections. An Istio VirtualService defines a set of traffic routing rules to apply when a host is addressed. Lastly, an Istio DestinationRule defines policies that apply to traffic intended for a Service after routing has occurred. You need to deploy an Istio Gateway and a set of VirtualService. You will also need to deploy a set of DestinationRule resources. Create the Istio Gateway, Virtual Services, and Destination Rules, which you modified earlier.
kubectl apply -f resources/istio/gateway.yaml -n dev
kubectl apply -f resources/istio/virtualservices.yaml -n dev
kubectl apply -f resources/istio/destination-rules.yaml -n dev
Deploy Istio Telemetry Add-ons
The Istio project includes sample deployments of various telemetry add-ons that integrate with Istio. The add-ons include Jaeger, Zipkin, Kiali, Prometheus, and Grafana. While these applications are not a part of Istio, they are essential to making the most of Istio’s observability features. According to the Istio project, the deployments are meant to quickly get up and running and are optimized for this case. As a result, they may not be suitable for production. See the GitHub project for more info on integrating a production-grade version of each add-on.
Install the add-ons using the default configurations and then replace Prometheus with a modified version included in the project. The modified Kubernetes ConfigMap in the prometheus.yaml file has added configuration to scrape our reference platform’s /api/metrics endpoint.
kubectl apply -f $ISTIO_HOME/samples/addons
kubectl apply -f resources/istio/prometheus.yaml -n istio-system
You should see seven workloads in the namespace from the EKS Management Console’s Workloads tab, each with one pod up and running. The workloads include Grafana, Jaeger, Kiali, and Prometheus. Also included is the Istio Configuration demo Profile’s istiod, istio-ingressgateway, and istio-egressgateway, installed previously.

Deploy Kubernetes Web UI (Dashboard)
Kubernetes Web UI (Dashboard) is a web-based Kubernetes user interface. You can use the Dashboard to deploy containerized applications to a Kubernetes cluster, troubleshoot your containerized application, and manage cluster resources. You can use the Dashboard to get an overview of applications running on your cluster, as well as for creating or modifying individual Kubernetes resources.

To deploy the dashboard, follow the steps outlined in the Tutorial: Deploy the Kubernetes Dashboard (web UI).
kubectl apply -f https://raw.githubusercontent.com/kubernetes/dashboard/v2.0.5/aio/deploy/recommended.yaml
kubectl apply -f resources/aws/eks-admin-service-account.yaml
Each Service Account has a Secret with a valid Bearer Token that can be used to log in to the Dashboard. Use the following command to retrieve the token associated with the eks-admin Account.
kubectl -n kube-system describe secret $(kubectl -n kube-system get secret | grep eks-admin | awk '{print $1}')
Start the kubectl proxy in a separate terminal window.
kubectl proxy
Use the eks-admin Account’s token to log in to the Kubernetes Dashboard at the following URL:
http://localhost:8001/api/v1/namespaces/kubernetes-dashboard/services/https:kubernetes-dashboard:/proxy/#!/login

Deploy Mongo Express
Mongo Express is a web-based MongoDB administrative interface written with Node.js, Express, and Bootstrap3. Install Mongo Express into the mongo-express namespace on the EKS cluster to manage the DocumentDB cluster.
kubectl apply -f ./resources/services/mongo-express.yaml -n mongo-express
Obtain the external IP address of any of the Kubernetes worker nodes and the NodePort of Mongo Express with the following two commands:
kubectl get nodes -o wide | awk {'print $1" " $2 " " $7'} | column -t
kubectl get service/mongo-express -n mongo-express
To ensure secure access to Mongo Express, create an Inbound Rule in your VPC’s Security Group that allows only your IP address (the ‘My IP’ option) access to Mongo Express running on the NodePort obtained above.

Start the kubectl proxy in a separate terminal window.
kubectl proxy
Use the external IP address of any of the Kubernetes worker nodes and current NodePort to access Mongo Express. Mongo Express will require you to enter the username and password you encoded in the Kubernetes Secret created earlier using basic authentication. Once you have deployed the reference application platform, later in the post, you will observe four databases: service-c, service-f, service-g, and service-h. The typical operational databases you would normally see with your own MongoDB installation are unavailable in the UI since DocumentDB is a managed service.

Modify and Deploy the ALB Ingress
The project contains an ALB Ingress resource, alb-ingress.yaml. The AWS Load Balancer Controller installed earlier is configured to limit the ingresses ALB ingress controller controls. By setting the --ingress-class=alb argument, it constrains the controller’s scope to ingresses with matching kubernetes.io/ingress.class: alb annotation. This is especially helpful when running multiple ingress controllers in the same cluster.
The ALB Ingress resource, alb-ingress.yaml, needs to be modified before deployment. First, update the alb.ingress.kubernetes.io/healthcheck-port annotation. The port value is derived from the status-port of the istio-ingressgateway, which was installed as part of the Istio demo configuration profile. To obtain the status-port from the istio-ingressgateway, run the following command:
kubectl -n istio-system get svc istio-ingressgateway \
  -o jsonpath='{.spec.ports[?(@.name=="status-port")].nodePort}'
Next, insert the ARN of your SSL/TLS (Transport Layer Security) certificate that is associated with the domain listed in the external-dns.alpha.kubernetes.io/hostname annotation into the ALB Ingress resource, alb-ingress.yaml. Run the following command to insert the TLS certificate’s ARN into the alb.ingress.kubernetes.io/certificate-arn annotation. This command assumes that your SSL/TLS certificate is registered with AWS Certificate Manager (ACM).
export ALB_CERT=$(aws acm list-certificates --certificate-statuses ISSUED \
  | jq -r '.CertificateSummaryList[] | select(.DomainName=="*.example-api.com") | .CertificateArn')
yq e '.metadata.annotations."alb.ingress.kubernetes.io/certificate-arn" = env(ALB_CERT)' -i resources/other/alb-ingress.yaml
The alb.ingress.kubernetes.io/actions.ssl-redirect annotation will redirect all HTTP traffic to HTTPS. The TLS certificate is used for HTTPS traffic. The ALB then terminates the HTTPS traffic at the ALB and forwards the unencrypted traffic to the EKS cluster on port 80.
Finally, update external-dns.alpha.kubernetes.io/hostname annotation with a common-delimited list of your platform’s UI and API hostnames. Below is the complete ALB Ingress resource, alb-ingress.yaml.
apiVersion: networking.k8s.io/v1
kind: Ingress
metadata:
  name: demo-ingress
  namespace: istio-system
  annotations:
    kubernetes.io/ingress.class: alb
    alb.ingress.kubernetes.io/scheme: internet-facing
    alb.ingress.kubernetes.io/tags: Environment=dev
    alb.ingress.kubernetes.io/healthcheck-port: '{{ your_status_port }}'
    alb.ingress.kubernetes.io/healthcheck-path: /healthz/ready
    alb.ingress.kubernetes.io/healthcheck-protocol: HTTP
    alb.ingress.kubernetes.io/listen-ports: '[{"HTTP": 80}, {"HTTPS":443}]'
    alb.ingress.kubernetes.io/actions.ssl-redirect: '{"Type": "redirect", "RedirectConfig": { "Protocol": "HTTPS", "Port": "443", "StatusCode": "HTTP_301"}}'
    external-dns.alpha.kubernetes.io/hostname: "{{ your_ui_hostname, your_api_hostname }}"
    alb.ingress.kubernetes.io/certificate-arn: "{{ your_ssl_tls_cert_arn }}"
    alb.ingress.kubernetes.io/load-balancer-attributes: routing.http2.enabled=true,idle_timeout.timeout_seconds=30
  labels:
    app: reference-app
spec:
  rules:
    - http:
        paths:
          - pathType: Prefix
            path: /
            backend:
              service:
                name: ssl-redirect
                port:
                  name: use-annotation
          - pathType: Prefix
            path: /
            backend:
              service:
                name: istio-ingressgateway
                port:
                  number: 80
          - pathType: Prefix
            path: /api
            backend:
              service:
                name: istio-ingressgateway
                port:
                  number: 80
To deploy the ALB Ingress resource, alb-ingress.yaml, run the following command:
kubectl apply -f resources/other/alb-ingress.yaml
To confirm the configuration of the AWS Load Balancer Controller and the ingresses ALB ingress controller controls, run the following command:
kubectl describe ingress.networking.k8s.io --all-namespaces
Any misconfigurations should show up as errors in the Events section.

Running the following command should display the public DNS address of the ALB associated with port 80.
kubectl -n istio-system get ingress
NAME           CLASS    HOSTS   ADDRESS                                                                   PORTS   AGE
demo-ingress   <none>   *       k8s-istiosys-demoingr-...us-east-1.elb.amazonaws.com   80      23m
Use the EC2 Load Balancer Management Console to review the new ALB’s details.

Deploy Fluent Bit
According to a recent AWS Blog post, Fluent Bit Integration in CloudWatch Container Insights for EKS, Fluent Bit is an open-source, multi-platform log processor and forwarder that allows you to collect data and logs from different sources and unify and send them to different destinations, including CloudWatch Logs. Fluent Bit is also fully compatible with Docker and Kubernetes environments. Using the newly launched Fluent Bit DaemonSet, you can send container logs from your EKS clusters to CloudWatch logs for logs storage and analytics.
We will use Fluent Bit to send the reference platform’s logs to Amazon CloudWatch Container Insights. To install Fluent Bit, I have used the procedure outlined in the AWS documentation: Quick Start Setup for Container Insights on Amazon EKS and Kubernetes. I recommend reviewing this documentation for detailed installation instructions.
kubectl apply -f https://raw.githubusercontent.com/aws-samples/amazon-cloudwatch-container-insights/latest/k8s-deployment-manifest-templates/deployment-mode/daemonset/container-insights-monitoring/cloudwatch-namespace.yaml

ClusterName=${CLUSTER_NAME}
RegionName=${EKS_REGION}
FluentBitHttpPort='2020'
FluentBitReadFromHead='Off'
[[ ${FluentBitReadFromHead} = 'On' ]] && FluentBitReadFromTail='Off'|| FluentBitReadFromTail='On'
[[ -z ${FluentBitHttpPort} ]] && FluentBitHttpServer='Off' || FluentBitHttpServer='On'
kubectl create configmap fluent-bit-cluster-info \
--from-literal=cluster.name=${ClusterName} \
--from-literal=http.server=${FluentBitHttpServer} \
--from-literal=http.port=${FluentBitHttpPort} \
--from-literal=read.head=${FluentBitReadFromHead} \
--from-literal=read.tail=${FluentBitReadFromTail} \
--from-literal=logs.region=${RegionName} -n amazon-cloudwatch

kubectl apply -f https://raw.githubusercontent.com/aws-samples/amazon-cloudwatch-container-insights/latest/k8s-deployment-manifest-templates/deployment-mode/daemonset/container-insights-monitoring/fluent-bit/fluent-bit.yaml

kubectl get pods -n amazon-cloudwatch

DASHBOARD_NAME=istio_observe_demo
REGION_NAME=${EKS_REGION}
CLUSTER_NAME=${CLUSTER_NAME}

curl https://raw.githubusercontent.com/aws-samples/amazon-cloudwatch-container-insights/latest/k8s-deployment-manifest-templates/deployment-mode/service/cwagent-prometheus/sample_cloudwatch_dashboards/fluent-bit/cw_dashboard_fluent_bit.json \
| sed "s/{{YOUR_AWS_REGION}}/${REGION_NAME}/g" \
| sed "s/{{YOUR_CLUSTER_NAME}}/${CLUSTER_NAME}/g" \
| xargs -0 aws cloudwatch put-dashboard --dashboard-name ${DASHBOARD_NAME} --dashboard-body

curl https://raw.githubusercontent.com/aws-samples/amazon-cloudwatch-container-insights/latest/k8s-deployment-manifest-templates/deployment-mode/daemonset/container-insights-monitoring/fluentd/fluentd.yaml | kubectl delete -f -
kubectl delete configmap cluster-info -n amazon-cloudwatch
From the EKS Management Console’s Workloads tab, you should see three fluent-bit pods up and running in the amazon-cloudwatch namespace. There is one fluent-bit pod per EKS worker node.

Once the reference application platform is deployed and running, you should be able to visualize the application in the Amazon CloudWatch Container Insights console’s Map view.

The reference platform’s cluster logs will also be available in Amazon CloudWatch. You should have access to individual Log groups for each application’s components.

Lastly, individual pod logs can also be viewed through the Kubernetes Dashboard. The microservice’s log verbosity level is set to info by default. This level can be changed using the LOG_LEVEL environment variable in the service’s Kubernetes Deployment resource.

Deploy ServiceEntry Resources
Using Istio ServiceEntry configurations, you can reach any publicly accessible service from within your Istio cluster. The Istio proxy can be configured to block any host without an HTTP service or service entry defined within the mesh. We will not go to this extreme in the demonstration. However, we will configure ServiceEntry configurations to monitor egress traffic to the reference platform’s two external services, DocumentDB and Amazon MQ.
Confirm the istio-egressgateway is running, then deploy the two ServiceEntry resources you modified earlier.
kubectl get pod -l istio=egressgateway -n istio-system
NAME                                   READY   STATUS    RESTARTS   AGE
istio-egressgateway-585f7668fc-74qtf   1/1     Running   0          14h
kubectl apply -f resources/istio/external-mesh-document-db-internal.yaml
kubectl apply -f resources/istio/external-mesh-amazon-mq-internal.yaml
Deploy the Reference Application Platform
Each of the platform’s components has a file in the project containing both the Kubernetes Service and corresponding Deployment resources.
Deploy the reference application platform’s frontend UI and eight backend microservices to the EKS cluster using the following commands:
kubectl apply -f ./resources/services/angular-ui.yaml -n dev

for service in a b c d e f g h; do
  kubectl apply -f "./resources/services/service-$service.yaml" -n dev
done
From the EKS Management Console’s Workloads tab, you should observe that the three pods for each reference application platform component are up and running in the dev namespace.

You can also use the Kubernetes Dashboard to confirm that the deployments were successful to the dev namespace.

Test the Platform
You want to ensure the platform’s web-based UI is reachable via the AWS Application Load Balancer to EKS through Istio and to the UI’s FQDN (fully qualified domain name) of angular-ui.dev.svc.cluster.local. You want to ensure the platform’s eight microservices are communicating with each other and communicating with the external DocumentDB cluster and Amazon MQ RabbitMQ broker. The easiest way to test the cluster is by viewing the Angular UI in a web browser. For example, in my case, https://observe-ui.example-api.com.
The UI requires you to input the hostname of the backend, which is the edge service, Service A. For example, in my case, https://observe-api.example-api.com. Since you want to use your own hostname and the UI’s JavaScript code is running locally in your web browser, this option allows you to provide your own hostname. This is the same hostname you inserted into the Istio VirtualService for Service A. This hostname routes the API calls to the FQDN of Service A running in the dev namespace, service-a.dev.svc.cluster.local. You should observe seven greeting responses displayed in the UI, all but Service F.
You can also use tools like Postman to test the backend directly, using the same hostname of the backend, as above.


Load Testing with Hey
You can also use performance testing tools to load-test the platform. Many issues will not show up until the platform is placed under elevated load. I recently tried hey, a modern go-based load generator tool as a replacement for Apache Bench (ab), Unlike ab, hey supports HTTP/2 endpoints, which is required to test the platform on EKS with Istio. You can install hey with Homebrew.
brew install hey
Using hey, you can test the reference application platform by hitting the API hostname and /api/greeting endpoint. The command below generates 1,000 requests, simulates 25 concurrent users, and uses HTTP/2. Traffic will be generated across all the services, the RabbitMQ broker, and the DocumentDB databases.
hey -n 1000 -c 25 -h2 {{ your_api_hostname }}/api/greetingThe results show 1,000 successful HTTP 200 responses from the reference platform’s API in about 43 seconds with an average response time of 1.0430 seconds.

To generate a consistent level of traffic over a longer period of time, try this variation of the command:
hey -n25000-c 25-q 1-h2{{ your_api_hostname }}/api/greeting
This command generates a steady stream of traffic for about 18 minutes, making it more convenient when exploring and troubleshooting your observability tools.

Part Two
In part two of this post, we will explore each observability tool and see how they can help us manage the reference application platform running on the EKS cluster.

To tear down the EKS cluster, DocumentDB cluster, and Amazon MQ broker, use the commands below.
# EKS cluster
eksctl delete cluster --name $CLUSTER_NAME

# Amazon MQ
aws mq list-brokers | jq -r '.BrokerSummaries[] | .BrokerId'
aws mq delete-broker --broker-id {{ your_broker_id }}
# DocumentDB
aws docdb describe-db-clusters \
    | jq -r '.DBClusters[] | .DbClusterResourceId'
aws docdb delete-db-cluster \
    --db-cluster-identifier {{ your_cluster_id }}
This blog represents my own viewpoints and not of my employer, Amazon Web Services (AWS). All product names, logos, and brands are the property of their respective owners.
Istio Observability with Go, gRPC, and Protocol Buffers-based Microservices on Google Kubernetes Engine (GKE)
Posted by Gary A. Stafford in Bash Scripting, Build Automation, Client-Side Development, Cloud, Continuous Delivery, DevOps, Enterprise Software Development, GCP, Go, JavaScript, Kubernetes, Software Development on April 17, 2019
In the last two posts, Kubernetes-based Microservice Observability with Istio Service Mesh and Azure Kubernetes Service (AKS) Observability with Istio Service Mesh, we explored the observability tools which are included with Istio Service Mesh. These tools currently include Prometheus and Grafana for metric collection, monitoring, and alerting, Jaeger for distributed tracing, and Kiali for Istio service-mesh-based microservice visualization and monitoring. Combined with cloud platform-native monitoring and logging services, such as Stackdriver on GCP, CloudWatch on AWS, Azure Monitor logs on Azure, and we have a complete observability solution for modern, distributed, Cloud-based applications.
In this post, we will examine the use of Istio’s observability tools to monitor Go-based microservices that use Protocol Buffers (aka Protobuf) over gRPC (gRPC Remote Procedure Calls) and HTTP/2 for client-server communications, as opposed to the more traditional, REST-based JSON (JavaScript Object Notation) over HTTP (Hypertext Transfer Protocol). We will see how Kubernetes, Istio, Envoy, and the observability tools work seamlessly with gRPC, just as they do with JSON over HTTP, on Google Kubernetes Engine (GKE).

Technologies
 gRPC
gRPC
According to the gRPC project, gRPC, a CNCF incubating project, is a modern, high-performance, open-source and universal remote procedure call (RPC) framework that can run anywhere. It enables client and server applications to communicate transparently and makes it easier to build connected systems. Google, the original developer of gRPC, has used the underlying technologies and concepts in gRPC for years. The current implementation is used in several Google cloud products and Google externally facing APIs. It is also being used by Square, Netflix, CoreOS, Docker, CockroachDB, Cisco, Juniper Networks and many other organizations.
 Protocol Buffers
By default, gRPC uses Protocol Buffers. According to Google, Protocol Buffers (aka Protobuf) are a language- and platform-neutral, efficient, extensible, automated mechanism for serializing structured data for use in communications protocols, data storage, and more. Protocol Buffers are 3 to 10 times smaller and 20 to 100 times faster than XML. Once you have defined your messages, you run the protocol buffer compiler for your application’s language on your .proto file to generate data access classes.
Protocol Buffers are 3 to 10 times smaller and 20 to 100 times faster than XML.
Protocol buffers currently support generated code in Java, Python, Objective-C, and C++, Dart, Go, Ruby, and C#. For this post, we have compiled for Go. You can read more about the binary wire format of Protobuf on Google’s Developers Portal.
 Envoy Proxy
According to the Istio project, Istio uses an extended version of the Envoy proxy. Envoy is deployed as a sidecar to a relevant service in the same Kubernetes pod. Envoy, created by Lyft, is a high-performance proxy developed in C++ to mediate all inbound and outbound traffic for all services in the service mesh. Istio leverages Envoy’s many built-in features, including dynamic service discovery, load balancing, TLS termination, HTTP/2 and gRPC proxies, circuit-breakers, health checks, staged rollouts, fault injection, and rich metrics.
According to the post by Harvey Tuch of Google, Evolving a Protocol Buffer canonical API, Envoy proxy adopted Protocol Buffers, specifically proto3, as the canonical specification of for version 2 of Lyft’s gRPC-first API.
Reference Microservices Platform
In the last two posts, we explored Istio’s observability tools, using a RESTful microservices-based API platform written in Go and using JSON over HTTP for service to service communications. The API platform was comprised of eight Go-based microservices and one sample Angular 7, TypeScript-based front-end web client. The various services are dependent on MongoDB, and RabbitMQ for event queue-based communications. Below, the is JSON over HTTP-based platform architecture.

Below, the current Angular 7-based web client interface.

Converting to gRPC and Protocol Buffers
For this post, I have modified the eight Go microservices to use gRPC and Protocol Buffers, Google’s data interchange format. Specifically, the services use version 3 release (aka proto3) of Protocol Buffers. With gRPC, a gRPC client calls a gRPC server. Some of the platform’s services are gRPC servers, others are gRPC clients, while some act as both client and server, such as Service A, B, and E. The revised architecture is shown below.
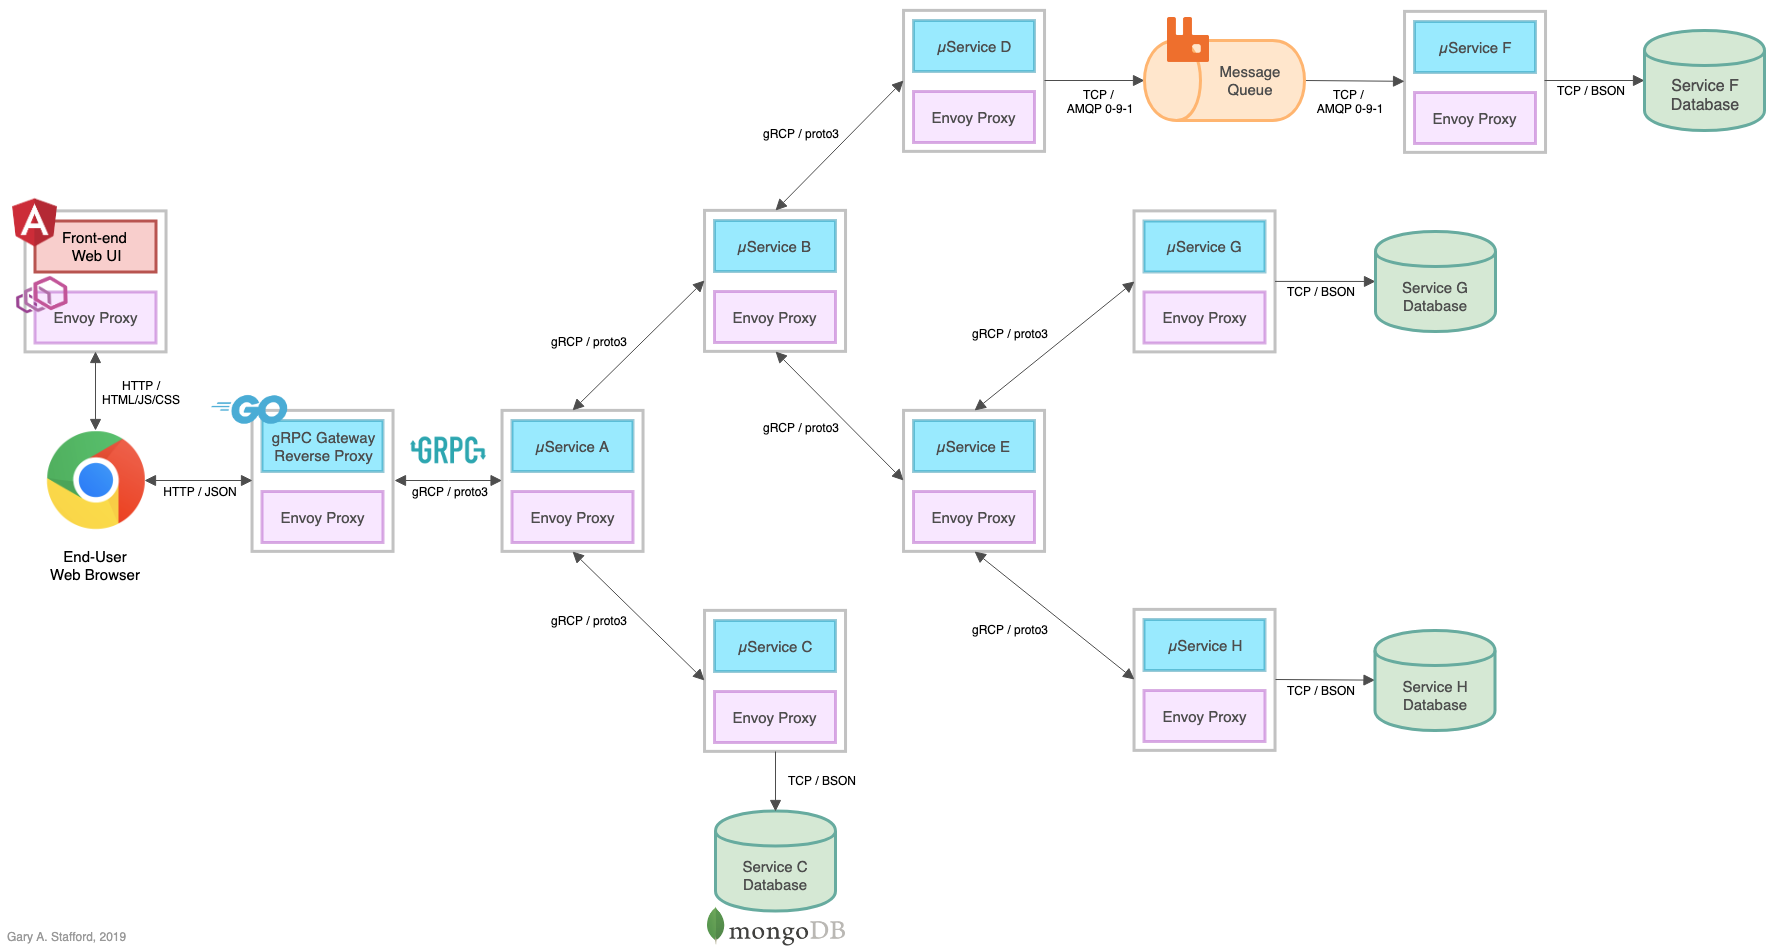
gRPC Gateway
Assuming for the sake of this demonstration, that most consumers of the API would still expect to communicate using a RESTful JSON over HTTP API, I have added a gRPC Gateway reverse proxy to the platform. The gRPC Gateway is a gRPC to JSON reverse proxy, a common architectural pattern, which proxies communications between the JSON over HTTP-based clients and the gRPC-based microservices. A diagram from the grpc-gateway GitHub project site effectively demonstrates how the reverse proxy works.

Image courtesy: https://github.com/grpc-ecosystem/grpc-gateway
In the revised platform architecture diagram above, note the addition of the reverse proxy, which replaces Service A at the edge of the API. The proxy sits between the Angular-based Web UI and Service A. Also, note the communication method between services is now Protobuf over gRPC instead of JSON over HTTP. The use of Envoy Proxy (via Istio) is unchanged, as is the MongoDB Atlas-based databases and CloudAMQP RabbitMQ-based queue, which are still external to the Kubernetes cluster.
Alternatives to gRPC Gateway
As an alternative to the gRPC Gateway reverse proxy, we could convert the TypeScript-based Angular UI client to gRPC and Protocol Buffers, and continue to communicate directly with Service A as the edge service. However, this would limit other consumers of the API to rely on gRPC as opposed to JSON over HTTP, unless we also chose to expose two different endpoints, gRPC, and JSON over HTTP, another common pattern.
Demonstration
In this post’s demonstration, we will repeat the exact same installation process, outlined in the previous post, Kubernetes-based Microservice Observability with Istio Service Mesh. We will deploy the revised gRPC-based platform to GKE on GCP. You could just as easily follow Azure Kubernetes Service (AKS) Observability with Istio Service Mesh, and deploy the platform to AKS.
Source Code
All source code for this post is available on GitHub, contained in three projects. The Go-based microservices source code, all Kubernetes resources, and all deployment scripts are located in the k8s-istio-observe-backend project repository, in the new grpc branch.
git clone \
  --branch grpc --single-branch --depth 1 --no-tags \
  https://github.com/garystafford/k8s-istio-observe-backend.git
The Angular-based web client source code is located in the k8s-istio-observe-frontend repository on the new grpc branch. The source protocol buffers .proto file and the generated code, using the protocol buffers compiler, is located in the new pb-greeting project repository. You do not need to clone either of these projects for this post’s demonstration.
All Docker images for the services, UI, and the reverse proxy are located on Docker Hub.
Code Changes
This post is not specifically about writing Go for gRPC and Protobuf. However, to better understand the observability requirements and capabilities of these technologies, compared to JSON over HTTP, it is helpful to review some of the source code.
Service A
First, compare the source code for Service A, shown below, to the original code in the previous post. The service’s code is almost completely re-written. I relied on several references for writing the code, including, Tracing gRPC with Istio, written by Neeraj Poddar of Aspen Mesh and Distributed Tracing Infrastructure with Jaeger on Kubernetes, by Masroor Hasan.
Specifically, note the following code changes to Service A:
- Import of the pb-greeting protobuf package;
- Local Greeting struct replaced with
pb.Greetingstruct; - All services are now hosted on port
50051; - The HTTP server and all API resource handler functions are removed;
- Headers, used for distributed tracing with Jaeger, have moved from HTTP request object to metadata passed in the gRPC context object;
- Service A is coded as a gRPC server, which is called by the gRPC Gateway reverse proxy (gRPC client) via the
Greetingfunction; - The primary
PingHandlerfunction, which returns the service’s Greeting, is replaced by the pb-greeting protobuf package’sGreetingfunction; - Service A is coded as a gRPC client, calling both Service B and Service C using the
CallGrpcServicefunction; - CORS handling is offloaded to Istio;
- Logging methods are unchanged;
Source code for revised gRPC-based Service A (gist):
This file contains bidirectional Unicode text that may be interpreted or compiled differently than what appears below. To review, open the file in an editor that reveals hidden Unicode characters.
Learn more about bidirectional Unicode characters
| // author: Gary A. Stafford | |
| // site: https://programmaticponderings.com | |
| // license: MIT License | |
| // purpose: Service A – gRPC/Protobuf | |
| package main | |
| import ( | |
| "context" | |
| "github.com/banzaicloud/logrus-runtime-formatter" | |
| "github.com/google/uuid" | |
| "github.com/grpc-ecosystem/go-grpc-middleware/tracing/opentracing" | |
| ot "github.com/opentracing/opentracing-go" | |
| log "github.com/sirupsen/logrus" | |
| "google.golang.org/grpc" | |
| "google.golang.org/grpc/metadata" | |
| "net" | |
| "os" | |
| "time" | |
| pb "github.com/garystafford/pb-greeting" | |
| ) | |
| const ( | |
| port = ":50051" | |
| ) | |
| type greetingServiceServer struct { | |
| } | |
| var ( | |
| greetings []*pb.Greeting | |
| ) | |
| func (s *greetingServiceServer) Greeting(ctx context.Context, req *pb.GreetingRequest) (*pb.GreetingResponse, error) { | |
| greetings = nil | |
| tmpGreeting := pb.Greeting{ | |
| Id: uuid.New().String(), | |
| Service: "Service-A", | |
| Message: "Hello, from Service-A!", | |
| Created: time.Now().Local().String(), | |
| } | |
| greetings = append(greetings, &tmpGreeting) | |
| CallGrpcService(ctx, "service-b:50051") | |
| CallGrpcService(ctx, "service-c:50051") | |
| return &pb.GreetingResponse{ | |
| Greeting: greetings, | |
| }, nil | |
| } | |
| func CallGrpcService(ctx context.Context, address string) { | |
| conn, err := createGRPCConn(ctx, address) | |
| if err != nil { | |
| log.Fatalf("did not connect: %v", err) | |
| } | |
| defer conn.Close() | |
| headersIn, _ := metadata.FromIncomingContext(ctx) | |
| log.Infof("headersIn: %s", headersIn) | |
| client := pb.NewGreetingServiceClient(conn) | |
| ctx, cancel := context.WithTimeout(context.Background(), 5*time.Second) | |
| ctx = metadata.NewOutgoingContext(context.Background(), headersIn) | |
| defer cancel() | |
| req := pb.GreetingRequest{} | |
| greeting, err := client.Greeting(ctx, &req) | |
| log.Info(greeting.GetGreeting()) | |
| if err != nil { | |
| log.Fatalf("did not connect: %v", err) | |
| } | |
| for _, greeting := range greeting.GetGreeting() { | |
| greetings = append(greetings, greeting) | |
| } | |
| } | |
| func createGRPCConn(ctx context.Context, addr string) (*grpc.ClientConn, error) { | |
| //https://aspenmesh.io/2018/04/tracing-grpc-with-istio/ | |
| var opts []grpc.DialOption | |
| opts = append(opts, grpc.WithStreamInterceptor( | |
| grpc_opentracing.StreamClientInterceptor( | |
| grpc_opentracing.WithTracer(ot.GlobalTracer())))) | |
| opts = append(opts, grpc.WithUnaryInterceptor( | |
| grpc_opentracing.UnaryClientInterceptor( | |
| grpc_opentracing.WithTracer(ot.GlobalTracer())))) | |
| opts = append(opts, grpc.WithInsecure()) | |
| conn, err := grpc.DialContext(ctx, addr, opts…) | |
| if err != nil { | |
| log.Fatalf("Failed to connect to application addr: ", err) | |
| return nil, err | |
| } | |
| return conn, nil | |
| } | |
| func getEnv(key, fallback string) string { | |
| if value, ok := os.LookupEnv(key); ok { | |
| return value | |
| } | |
| return fallback | |
| } | |
| func init() { | |
| formatter := runtime.Formatter{ChildFormatter: &log.JSONFormatter{}} | |
| formatter.Line = true | |
| log.SetFormatter(&formatter) | |
| log.SetOutput(os.Stdout) | |
| level, err := log.ParseLevel(getEnv("LOG_LEVEL", "info")) | |
| if err != nil { | |
| log.Error(err) | |
| } | |
| log.SetLevel(level) | |
| } | |
| func main() { | |
| lis, err := net.Listen("tcp", port) | |
| if err != nil { | |
| log.Fatalf("failed to listen: %v", err) | |
| } | |
| s := grpc.NewServer() | |
| pb.RegisterGreetingServiceServer(s, &greetingServiceServer{}) | |
| log.Fatal(s.Serve(lis)) | |
| } |
Greeting Protocol Buffers
Shown below is the greeting source protocol buffers .proto file. The greeting response struct, originally defined in the services, remains largely unchanged (gist). The UI client responses will look identical.
This file contains bidirectional Unicode text that may be interpreted or compiled differently than what appears below. To review, open the file in an editor that reveals hidden Unicode characters.
Learn more about bidirectional Unicode characters
| syntax = "proto3"; | |
| package greeting; | |
| import "google/api/annotations.proto"; | |
| message Greeting { | |
| string id = 1; | |
| string service = 2; | |
| string message = 3; | |
| string created = 4; | |
| } | |
| message GreetingRequest { | |
| } | |
| message GreetingResponse { | |
| repeated Greeting greeting = 1; | |
| } | |
| service GreetingService { | |
| rpc Greeting (GreetingRequest) returns (GreetingResponse) { | |
| option (google.api.http) = { | |
| get: "/api/v1/greeting" | |
| }; | |
| } | |
| } |
When compiled with protoc, the Go-based protocol compiler plugin, the original 27 lines of source code swells to almost 270 lines of generated data access classes that are easier to use programmatically.
# Generate gRPC stub (.pb.go)
protoc -I /usr/local/include -I. \
  -I ${GOPATH}/src \
  -I ${GOPATH}/src/github.com/grpc-ecosystem/grpc-gateway/third_party/googleapis \
  --go_out=plugins=grpc:. \
  greeting.proto

# Generate reverse-proxy (.pb.gw.go)
protoc -I /usr/local/include -I. \
  -I ${GOPATH}/src \
  -I ${GOPATH}/src/github.com/grpc-ecosystem/grpc-gateway/third_party/googleapis \
  --grpc-gateway_out=logtostderr=true:. \
  greeting.proto

# Generate swagger definitions (.swagger.json)
protoc -I /usr/local/include -I. \
  -I ${GOPATH}/src \
  -I ${GOPATH}/src/github.com/grpc-ecosystem/grpc-gateway/third_party/googleapis \
  --swagger_out=logtostderr=true:. \
  greeting.proto
Below is a small snippet of that compiled code, for reference. The compiled code is included in the pb-greeting project on GitHub and imported into each microservice and the reverse proxy (gist). We also compile a separate version for the reverse proxy to implement.
This file contains bidirectional Unicode text that may be interpreted or compiled differently than what appears below. To review, open the file in an editor that reveals hidden Unicode characters.
Learn more about bidirectional Unicode characters
| // Code generated by protoc-gen-go. DO NOT EDIT. | |
| // source: greeting.proto | |
| package greeting | |
| import ( | |
| context "context" | |
| fmt "fmt" | |
| proto "github.com/golang/protobuf/proto" | |
| _ "google.golang.org/genproto/googleapis/api/annotations" | |
| grpc "google.golang.org/grpc" | |
| codes "google.golang.org/grpc/codes" | |
| status "google.golang.org/grpc/status" | |
| math "math" | |
| ) | |
| // Reference imports to suppress errors if they are not otherwise used. | |
| var _ = proto.Marshal | |
| var _ = fmt.Errorf | |
| var _ = math.Inf | |
| // This is a compile-time assertion to ensure that this generated file | |
| // is compatible with the proto package it is being compiled against. | |
| // A compilation error at this line likely means your copy of the | |
| // proto package needs to be updated. | |
| const _ = proto.ProtoPackageIsVersion3 // please upgrade the proto package | |
| type Greeting struct { | |
| Id string `protobuf:"bytes,1,opt,name=id,proto3" json:"id,omitempty"` | |
| Service string `protobuf:"bytes,2,opt,name=service,proto3" json:"service,omitempty"` | |
| Message string `protobuf:"bytes,3,opt,name=message,proto3" json:"message,omitempty"` | |
| Created string `protobuf:"bytes,4,opt,name=created,proto3" json:"created,omitempty"` | |
| XXX_NoUnkeyedLiteral struct{} `json:"-"` | |
| XXX_unrecognized []byte `json:"-"` | |
| XXX_sizecache int32 `json:"-"` | |
| } | |
| func (m *Greeting) Reset() { *m = Greeting{} } | |
| func (m *Greeting) String() string { return proto.CompactTextString(m) } | |
| func (*Greeting) ProtoMessage() {} | |
| func (*Greeting) Descriptor() ([]byte, []int) { | |
| return fileDescriptor_6acac03ccd168a87, []int{0} | |
| } | |
| func (m *Greeting) XXX_Unmarshal(b []byte) error { | |
| return xxx_messageInfo_Greeting.Unmarshal(m, b) | |
| } | |
| func (m *Greeting) XXX_Marshal(b []byte, deterministic bool) ([]byte, error) { | |
| return xxx_messageInfo_Greeting.Marshal(b, m, deterministic) |
Using Swagger, we can view the greeting protocol buffers’ single RESTful API resource, exposed with an HTTP GET method. I use the Docker-based version of Swagger UI for viewing protoc generated swagger definitions.
docker run -p 8080:8080 -d --name swagger-ui \
  -e SWAGGER_JSON=/tmp/greeting.swagger.json \
  -v ${GOAPTH}/src/pb-greeting:/tmp swaggerapi/swagger-ui
The Angular UI makes an HTTP GET request to the /api/v1/greeting resource, which is transformed to gRPC and proxied to Service A, where it is handled by the Greeting function.

gRPC Gateway Reverse Proxy
As explained earlier, the gRPC Gateway reverse proxy service is completely new. Specifically, note the following code features in the gist below:
- Import of the pb-greeting protobuf package;
- The proxy is hosted on port
80; - Request headers, used for distributed tracing with Jaeger, are collected from the incoming HTTP request and passed to Service A in the gRPC context;
- The proxy is coded as a gRPC client, which calls Service A;
- Logging is largely unchanged;
The source code for the Reverse Proxy (gist):
This file contains bidirectional Unicode text that may be interpreted or compiled differently than what appears below. To review, open the file in an editor that reveals hidden Unicode characters.
Learn more about bidirectional Unicode characters
| // author: Gary A. Stafford | |
| // site: https://programmaticponderings.com | |
| // license: MIT License | |
| // purpose: gRPC Gateway / Reverse Proxy | |
| // reference: https://github.com/grpc-ecosystem/grpc-gateway | |
| package main | |
| import ( | |
| "context" | |
| "flag" | |
| lrf "github.com/banzaicloud/logrus-runtime-formatter" | |
| gw "github.com/garystafford/pb-greeting" | |
| "github.com/grpc-ecosystem/grpc-gateway/runtime" | |
| log "github.com/sirupsen/logrus" | |
| "google.golang.org/grpc" | |
| "google.golang.org/grpc/metadata" | |
| "net/http" | |
| "os" | |
| ) | |
| func injectHeadersIntoMetadata(ctx context.Context, req *http.Request) metadata.MD { | |
| //https://aspenmesh.io/2018/04/tracing-grpc-with-istio/ | |
| var ( | |
| otHeaders = []string{ | |
| "x-request-id", | |
| "x-b3-traceid", | |
| "x-b3-spanid", | |
| "x-b3-parentspanid", | |
| "x-b3-sampled", | |
| "x-b3-flags", | |
| "x-ot-span-context"} | |
| ) | |
| var pairs []string | |
| for _, h := range otHeaders { | |
| if v := req.Header.Get(h); len(v) > 0 { | |
| pairs = append(pairs, h, v) | |
| } | |
| } | |
| return metadata.Pairs(pairs…) | |
| } | |
| type annotator func(context.Context, *http.Request) metadata.MD | |
| func chainGrpcAnnotators(annotators …annotator) annotator { | |
| return func(c context.Context, r *http.Request) metadata.MD { | |
| var mds []metadata.MD | |
| for _, a := range annotators { | |
| mds = append(mds, a(c, r)) | |
| } | |
| return metadata.Join(mds…) | |
| } | |
| } | |
| func run() error { | |
| ctx := context.Background() | |
| ctx, cancel := context.WithCancel(ctx) | |
| defer cancel() | |
| annotators := []annotator{injectHeadersIntoMetadata} | |
| mux := runtime.NewServeMux( | |
| runtime.WithMetadata(chainGrpcAnnotators(annotators…)), | |
| ) | |
| opts := []grpc.DialOption{grpc.WithInsecure()} | |
| err := gw.RegisterGreetingServiceHandlerFromEndpoint(ctx, mux, "service-a:50051", opts) | |
| if err != nil { | |
| return err | |
| } | |
| return http.ListenAndServe(":80", mux) | |
| } | |
| func getEnv(key, fallback string) string { | |
| if value, ok := os.LookupEnv(key); ok { | |
| return value | |
| } | |
| return fallback | |
| } | |
| func init() { | |
| formatter := lrf.Formatter{ChildFormatter: &log.JSONFormatter{}} | |
| formatter.Line = true | |
| log.SetFormatter(&formatter) | |
| log.SetOutput(os.Stdout) | |
| level, err := log.ParseLevel(getEnv("LOG_LEVEL", "info")) | |
| if err != nil { | |
| log.Error(err) | |
| } | |
| log.SetLevel(level) | |
| } | |
| func main() { | |
| flag.Parse() | |
| if err := run(); err != nil { | |
| log.Fatal(err) | |
| } | |
| } |
Below, in the Stackdriver logs, we see an example of a set of HTTP request headers in the JSON payload, which are propagated upstream to gRPC-based Go services from the gRPC Gateway’s reverse proxy. Header propagation ensures the request produces a complete distributed trace across the complete service call chain.

Istio VirtualService and CORS
According to feedback in the project’s GitHub Issues, the gRPC Gateway does not directly support Cross-Origin Resource Sharing (CORS) policy. In my own experience, the gRPC Gateway cannot handle OPTIONS HTTP method requests, which must be issued by the Angular 7 web UI. Therefore, I have offloaded CORS responsibility to Istio, using the VirtualService resource’s CorsPolicy configuration. This makes CORS much easier to manage than coding CORS configuration into service code (gist):
This file contains bidirectional Unicode text that may be interpreted or compiled differently than what appears below. To review, open the file in an editor that reveals hidden Unicode characters.
Learn more about bidirectional Unicode characters
| apiVersion: networking.istio.io/v1alpha3 | |
| kind: VirtualService | |
| metadata: | |
| name: service-rev-proxy | |
| spec: | |
| hosts: | |
| – api.dev.example-api.com | |
| gateways: | |
| – demo-gateway | |
| http: | |
| – match: | |
| – uri: | |
| prefix: / | |
| route: | |
| – destination: | |
| port: | |
| number: 80 | |
| host: service-rev-proxy.dev.svc.cluster.local | |
| weight: 100 | |
| corsPolicy: | |
| allowOrigin: | |
| – "*" | |
| allowMethods: | |
| – OPTIONS | |
| – GET | |
| allowCredentials: true | |
| allowHeaders: | |
| – "*" |
Set-up and Installation
To deploy the microservices platform to GKE, follow the detailed instructions in part one of the post, Kubernetes-based Microservice Observability with Istio Service Mesh: Part 1, or Azure Kubernetes Service (AKS) Observability with Istio Service Mesh for AKS.
- Create the external MongoDB Atlas database and CloudAMQP RabbitMQ clusters;
- Modify the Kubernetes resource files and bash scripts for your own environments;
- Create the managed GKE or AKS cluster on GCP or Azure;
- Configure and deploy Istio to the managed Kubernetes cluster, using Helm;
- Create DNS records for the platform’s exposed resources;
- Deploy the Go-based microservices, gRPC Gateway reverse proxy, Angular UI, and associated resources to Kubernetes cluster;
- Test and troubleshoot the platform deployment;
- Observe the results;
The Three Pillars
As introduced in the first post, logs, metrics, and traces are often known as the three pillars of observability. These are the external outputs of the system, which we may observe. As modern distributed systems grow ever more complex, the ability to observe those systems demands equally modern tooling that was designed with this level of complexity in mind. Traditional logging and monitoring systems often struggle with today’s hybrid and multi-cloud, polyglot language-based, event-driven, container-based and serverless, infinitely-scalable, ephemeral-compute platforms.
Tools like Istio Service Mesh attempt to solve the observability challenge by offering native integrations with several best-of-breed, open-source telemetry tools. Istio’s integrations include Jaeger for distributed tracing, Kiali for Istio service mesh-based microservice visualization and monitoring, and Prometheus and Grafana for metric collection, monitoring, and alerting. Combined with cloud platform-native monitoring and logging services, such as Stackdriver for GKE, CloudWatch for Amazon’s EKS, or Azure Monitor logs for AKS, and we have a complete observability solution for modern, distributed, Cloud-based applications.
Pillar 1: Logging
Moving from JSON over HTTP to gRPC does not require any changes to the logging configuration of the Go-based service code or Kubernetes resources.
Stackdriver with Logrus
As detailed in part two of the last post, Kubernetes-based Microservice Observability with Istio Service Mesh, our logging strategy for the eight Go-based microservices and the reverse proxy continues to be the use of Logrus, the popular structured logger for Go, and Banzai Cloud’s logrus-runtime-formatter.
If you recall, the Banzai formatter automatically tags log messages with runtime/stack information, including function name and line number; extremely helpful when troubleshooting. We are also using Logrus’ JSON formatter. Below, in the Stackdriver console, note how each log entry below has the JSON payload contained within the message with the log level, function name, lines on which the log entry originated, and the message.

Below, we see the details of a specific log entry’s JSON payload. In this case, we can see the request headers propagated from the downstream service.
Pillar 2: Metrics
Moving from JSON over HTTP to gRPC does not require any changes to the metrics configuration of the Go-based service code or Kubernetes resources.
Prometheus
Prometheus is a completely open source and community-driven systems monitoring and alerting toolkit originally built at SoundCloud, circa 2012. Interestingly, Prometheus joined the Cloud Native Computing Foundation (CNCF) in 2016 as the second hosted-project, after Kubernetes.

Grafana
Grafana describes itself as the leading open source software for time series analytics. According to Grafana Labs, Grafana allows you to query, visualize, alert on, and understand your metrics no matter where they are stored. You can easily create, explore, and share visually-rich, data-driven dashboards. Grafana allows users to visually define alert rules for your most important metrics. Grafana will continuously evaluate rules and can send notifications.
According to Istio, the Grafana add-on is a pre-configured instance of Grafana. The Grafana Docker base image has been modified to start with both a Prometheus data source and the Istio Dashboard installed. Below, we see two of the pre-configured dashboards, the Istio Mesh Dashboard and the Istio Performance Dashboard.


Pillar 3: Traces
Moving from JSON over HTTP to gRPC did require a complete re-write of the tracing logic in the service code. In fact, I spent the majority of my time ensuring the correct headers were propagated from the Istio Ingress Gateway to the gRPC Gateway reverse proxy, to Service A in the gRPC context, and upstream to all the dependent, gRPC-based services. I am sure there are a number of optimization in my current code, regarding the correct handling of traces and how this information is propagated across the service call stack.
Jaeger
According to their website, Jaeger, inspired by Dapper and OpenZipkin, is a distributed tracing system released as open source by Uber Technologies. It is used for monitoring and troubleshooting microservices-based distributed systems, including distributed context propagation, distributed transaction monitoring, root cause analysis, service dependency analysis, and performance and latency optimization. The Jaeger website contains an excellent overview of Jaeger’s architecture and general tracing-related terminology.
Below we see the Jaeger UI Traces View. In it, we see a series of traces generated by hey, a modern load generator and benchmarking tool, and a worthy replacement for Apache Bench (ab). Unlike ab, hey supports HTTP/2. The use of hey was detailed in the previous post.

A trace, as you might recall, is an execution path through the system and can be thought of as a directed acyclic graph (DAG) of spans. If you have worked with systems like Apache Spark, you are probably already familiar with DAGs.

Below we see the Jaeger UI Trace Detail View. The example trace contains 16 spans, which encompasses nine components – seven of the eight Go-based services, the reverse proxy, and the Istio Ingress Gateway. The trace and the spans each have timings. The root span in the trace is the Istio Ingress Gateway. In this demo, traces do not span the RabbitMQ message queues. This means you would not see a trace which includes the decoupled, message-based communications between Service D to Service F, via the RabbitMQ.

Within the Jaeger UI Trace Detail View, you also have the ability to drill into a single span, which contains additional metadata. Metadata includes the URL being called, HTTP method, response status, and several other headers.

Microservice Observability
Moving from JSON over HTTP to gRPC does not require any changes to the Kiali configuration of the Go-based service code or Kubernetes resources.
Kiali
According to their website, Kiali provides answers to the questions: What are the microservices in my Istio service mesh, and how are they connected? Kiali works with Istio, in OpenShift or Kubernetes, to visualize the service mesh topology, to provide visibility into features like circuit breakers, request rates and more. It offers insights about the mesh components at different levels, from abstract Applications to Services and Workloads.
The Graph View in the Kiali UI is a visual representation of the components running in the Istio service mesh. Below, filtering on the cluster’s dev Namespace, we should observe that Kiali has mapped all components in the platform, along with rich metadata, such as their version and communication protocols.
Using Kiali, we can confirm our service-to-service IPC protocol is now gRPC instead of the previous HTTP.

Conclusion
Although converting from JSON over HTTP to protocol buffers with gRPC required major code changes to the services, it did not impact the high-level observability we have of those services using the tools provided by Istio, including Prometheus, Grafana, Jaeger, and Kiali.
All opinions expressed in this post are my own and not necessarily the views of my current or past employers or their clients.
Azure Kubernetes Service (AKS) Observability with Istio Service Mesh
Posted by Gary A. Stafford in Azure, Bash Scripting, Cloud, DevOps, Go, JavaScript, Kubernetes, Software Development on March 31, 2019
In the last two-part post, Kubernetes-based Microservice Observability with Istio Service Mesh, we deployed Istio, along with its observability tools, Prometheus, Grafana, Jaeger, and Kiali, to Google Kubernetes Engine (GKE). Following that post, I received several questions about using Istio’s observability tools with other popular managed Kubernetes platforms, primarily Azure Kubernetes Service (AKS). In most cases, including with AKS, both Istio and the observability tools are compatible.
In this short follow-up of the last post, we will replace the GKE-specific cluster setup commands, found in part one of the last post, with new commands to provision a similar AKS cluster on Azure. The new AKS cluster will run Istio 1.1.3, released 4/15/2019, alongside the latest available version of AKS (Kubernetes), 1.12.6. We will replace Google’s Stackdriver logging with Azure Monitor logs. We will retain the external MongoDB Atlas cluster and the external CloudAMQP cluster dependencies.
Previous articles about AKS include First Impressions of AKS, Azure’s New Managed Kubernetes Container Service (November 2017) and Architecting Cloud-Optimized Apps with AKS (Azure’s Managed Kubernetes), Azure Service Bus, and Cosmos DB (December 2017).
Source Code
All source code for this post is available on GitHub in two projects. The Go-based microservices source code, all Kubernetes resources, and all deployment scripts are located in the k8s-istio-observe-backend project repository.
git clone \
  --branch master --single-branch \
  --depth 1 --no-tags \
  https://github.com/garystafford/k8s-istio-observe-backend.git
The Angular UI TypeScript-based source code is located in the k8s-istio-observe-frontend repository. You will not need to clone the Angular UI project for this post’s demonstration.
Setup
This post assumes you have a Microsoft Azure account with the necessary resource providers registered, and the Azure Command-Line Interface (CLI), az, installed and available to your command shell. You will also need Helm and Istio 1.1.3 installed and configured, which is covered in the last post.

Start by logging into Azure from your command shell.
az login \
  --username {{ your_username_here }} \
  --password {{ your_password_here }}
Resource Providers
If you are new to Azure or AKS, you may need to register some additional resource providers to complete this demonstration.
az provider list --output table

If you are missing required resource providers, you will see errors similar to the one shown below. Simply activate the particular provider corresponding to the error.
Operation failed with status:'Bad Request'.
Details: Required resource provider registrations
Microsoft.Compute, Microsoft.Network are missing.
To register the necessary providers, use the Azure CLI or the Azure Portal UI.
az provider register --namespace Microsoft.ContainerService
az provider register --namespace Microsoft.Network
az provider register --namespace Microsoft.Compute
Resource Group
AKS requires an Azure Resource Group. According to Azure, a resource group is a container that holds related resources for an Azure solution. The resource group includes those resources that you want to manage as a group. I chose to create a new resource group associated with my closest geographic Azure Region, East US, using the Azure CLI.
az group create \
  --resource-group aks-observability-demo \
  --location eastus

Create the AKS Cluster
Before creating the GKE cluster, check for the latest versions of AKS. At the time of this post, the latest versions of AKS was 1.12.6.
az aks get-versions \
  --location eastus \
  --output table

Using the latest GKE version, create the GKE managed cluster. There are many configuration options available with the az aks create command. For this post, I am creating three worker nodes using the Azure Standard_DS3_v2 VM type, which will give us a total of 12 vCPUs and 42 GB of memory. Anything smaller and all the Pods may not be schedulable. Instead of supplying an existing SSH key, I will let Azure create a new one. You should have no need to SSH into the worker nodes. I am also enabling the monitoring add-on. According to Azure, the add-on sets up Azure Monitor for containers, announced in December 2018, which monitors the performance of workloads deployed to Kubernetes environments hosted on AKS.
time az aks create \
  --name aks-observability-demo \
  --resource-group aks-observability-demo \
  --node-count 3 \
  --node-vm-size Standard_DS3_v2 \
  --enable-addons monitoring \
  --generate-ssh-keys \
  --kubernetes-version 1.12.6
Using the time command, we observe that the cluster took approximately 5m48s to provision; I have seen times up to almost 10 minutes. AKS provisioning is not as fast as GKE, which in my experience is at least 2x-3x faster than AKS for a similarly sized cluster.

After the cluster creation completes, retrieve your AKS cluster credentials.
az aks get-credentials \
  --name aks-observability-demo \
  --resource-group aks-observability-demo \
  --overwrite-existing
Examine the Cluster
Use the following command to confirm the cluster is ready by examining the status of three worker nodes.
kubectl get nodes --output=wide

Observe that Azure currently uses Ubuntu 16.04.5 LTS for the worker node’s host operating system. If you recall, GKE offers both Ubuntu as well as a Container-Optimized OS from Google.
Kubernetes Dashboard
Unlike GKE, there is no custom AKS dashboard. Therefore, we will use the Kubernetes Web UI (dashboard), which is installed by default with AKS, unlike GKE. According to Azure, to make full use of the dashboard, since the AKS cluster uses RBAC, a ClusterRoleBinding must be created before you can correctly access the dashboard.
kubectl create clusterrolebinding kubernetes-dashboard \
  --clusterrole=cluster-admin \
  --serviceaccount=kube-system:kubernetes-dashboard
Next, we must create a proxy tunnel on local port 8001 to the dashboard running on the AKS cluster. This CLI command creates a proxy between your local system and the Kubernetes API and opens your web browser to the Kubernetes dashboard.
az aks browse \
  --name aks-observability-demo \
  --resource-group aks-observability-demo

Although you should use the Azure CLI, PowerShell, or SDK for all your AKS configuration tasks, using the dashboard for monitoring the cluster and the resources running on it, is invaluable.

The Kubernetes dashboard also provides access to raw container logs. Azure Monitor provides the ability to construct complex log queries, but for quick troubleshooting, you may just want to see the raw logs a specific container is outputting, from the dashboard.

Azure Portal
Logging into the Azure Portal, we can observe the AKS cluster, within the new Resource Group.

In addition to the Azure Resource Group we created, there will be a second Resource Group created automatically during the creation of the AKS cluster. This group contains all the resources that compose the AKS cluster. These resources include the three worker node VM instances, and their corresponding storage disks and NICs. The group also includes a network security group, route table, virtual network, and an availability set.

Deploy Istio
From this point on, the process to deploy Istio Service Mesh and the Go-based microservices platform follows the previous post and use the exact same scripts. After modifying the Kubernetes resource files, to deploy Istio, use the bash script, part4_install_istio.sh. I have added a few more pauses in the script to account for the apparently slower response times from AKS as opposed to GKE. It definitely takes longer to spin up the Istio resources on AKS than on GKE, which can result in errors if you do not pause between each stage of the deployment process.


Using the Kubernetes dashboard, we can view the Istio resources running in the istio-system Namespace, as shown below. Confirm that all resource Pods are running and healthy before deploying the Go-based microservices platform.

Deploy the Platform
Deploy the Go-based microservices platform, using bash deploy script, part5a_deploy_resources.sh.

The script deploys two replicas (Pods) of each of the eight microservices, Service-A through Service-H, and the Angular UI, to the dev and test Namespaces, for a total of 36 Pods. Each Pod will have the Istio sidecar proxy (Envoy Proxy) injected into it, alongside the microservice or UI.

Azure Load Balancer
If we return to the Resource Group created automatically when the AKS cluster was created, we will now see two additional resources. There is now an Azure Load Balancer and Public IP Address.

Similar to the GKE cluster in the last post, when the Istio Ingress Gateway is deployed as part of the platform, it is materialized as an Azure Load Balancer. The front-end of the load balancer is the new public IP address. The back-end of the load-balancer is a pool containing the three AKS worker node VMs. The load balancer is associated with a set of rules and health probes.

DNS
I have associated the new Azure public IP address, connected with the front-end of the load balancer, with the four subdomains I am using to represent the UI and the edge service, Service-A, in both Namespaces. If Azure is your primary Cloud provider, then Azure DNS is a good choice to manage your domain’s DNS records. For this demo, you will require your own domain.

Testing the Platform
With everything deployed, test the platform is responding and generate HTTP traffic for the observability tools to record. Similar to last time, I have chosen hey, a modern load generator and benchmarking tool, and a worthy replacement for Apache Bench (ab). Unlike ab, hey supports HTTP/2. Below, I am running hey directly from Azure Cloud Shell. The tool is simulating 10 concurrent users, generating a total of 500 HTTP GET requests to Service A.
# quick setup from Azure Shell using Bash
go get -u github.com/rakyll/hey
cd go/src/github.com/rakyll/hey/
go build

./hey -n 500 -c 10 -h2 http://api.dev.example-api.com/api/ping
We had 100% success with all 500 calls resulting in an HTTP 200 OK success status response code. Based on the results, we can observe the platform was capable of approximately 4 requests/second, with an average response time of 2.48 seconds and a mean time of 2.80 seconds. Almost all of that time was the result of waiting for the response, as the details indicate.

Logging
In this post, we have replaced GCP’s Stackdriver logging with Azure Monitor logs. According to Microsoft, Azure Monitor maximizes the availability and performance of applications by delivering a comprehensive solution for collecting, analyzing, and acting on telemetry from Cloud and on-premises environments. In my opinion, Stackdriver is a superior solution for searching and correlating the logs of distributed applications running on Kubernetes. I find the interface and query language of Stackdriver easier and more intuitive than Azure Monitor, which although powerful, requires substantial query knowledge to obtain meaningful results. For example, here is a query to view the log entries from the services in the dev Namespace, within the last day.
let startTimestamp = ago(1d);
KubePodInventory
| where TimeGenerated > startTimestamp
| where ClusterName =~ "aks-observability-demo"
| where Namespace == "dev"
| where Name contains "service-"
| distinct ContainerID
| join
(
    ContainerLog
    | where TimeGenerated > startTimestamp
)
on ContainerID
| project LogEntrySource, LogEntry, TimeGenerated, Name
| order by TimeGenerated desc
| render table
Below, we see the Logs interface with the search query and log entry results.

Below, we see a detailed view of a single log entry from Service A.

Observability Tools
The previous post goes into greater detail on the features of each of the observability tools provided by Istio, including Prometheus, Grafana, Jaeger, and Kiali.
We can use the exact same kubectl port-forward commands to connect to the tools on AKS as we did on GKE. According to Google, Kubernetes port forwarding allows using a resource name, such as a service name, to select a matching pod to port forward to since Kubernetes v1.10. We forward a local port to a port on the tool’s pod.
# Grafana
kubectl port-forward -n istio-system \
  $(kubectl get pod -n istio-system -l app=grafana \
  -o jsonpath='{.items[0].metadata.name}') 3000:3000 &

# Prometheus
kubectl -n istio-system port-forward \
  $(kubectl -n istio-system get pod -l app=prometheus \
  -o jsonpath='{.items[0].metadata.name}') 9090:9090 &

# Jaeger
kubectl port-forward -n istio-system \
$(kubectl get pod -n istio-system -l app=jaeger \
-o jsonpath='{.items[0].metadata.name}') 16686:16686 &

# Kiali
kubectl -n istio-system port-forward \
  $(kubectl -n istio-system get pod -l app=kiali \
  -o jsonpath='{.items[0].metadata.name}') 20001:20001 &

Prometheus and Grafana
Prometheus is a completely open source and community-driven systems monitoring and alerting toolkit originally built at SoundCloud, circa 2012. Interestingly, Prometheus joined the Cloud Native Computing Foundation (CNCF) in 2016 as the second hosted-project, after Kubernetes.
Grafana describes itself as the leading open source software for time series analytics. According to Grafana Labs, Grafana allows you to query, visualize, alert on, and understand your metrics no matter where they are stored. You can easily create, explore, and share visually-rich, data-driven dashboards. Grafana also users to visually define alert rules for your most important metrics. Grafana will continuously evaluate rules and can send notifications.
According to Istio, the Grafana add-on is a pre-configured instance of Grafana. The Grafana Docker base image has been modified to start with both a Prometheus data source and the Istio Dashboard installed. Below, we see one of the pre-configured dashboards, the Istio Service Dashboard.

Jaeger
According to their website, Jaeger, inspired by Dapper and OpenZipkin, is a distributed tracing system released as open source by Uber Technologies. It is used for monitoring and troubleshooting microservices-based distributed systems, including distributed context propagation, distributed transaction monitoring, root cause analysis, service dependency analysis, and performance and latency optimization. The Jaeger website contains a good overview of Jaeger’s architecture and general tracing-related terminology.

Below, we see a typical, distributed trace of the services, starting ingress gateway and passing across the upstream service dependencies.

Kaili
According to their website, Kiali provides answers to the questions: What are the microservices in my Istio service mesh, and how are they connected? Kiali works with Istio, in OpenShift or Kubernetes, to visualize the service mesh topology, to provide visibility into features like circuit breakers, request rates and more. It offers insights about the mesh components at different levels, from abstract Applications to Services and Workloads.
There is a common Kubernetes Secret that controls access to the Kiali API and UI. The default login is admin, the password is 1f2d1e2e67df.

Below, we see a detailed view of our platform, running in the dev namespace, on AKS.

Delete AKS Cluster
Once you are finished with this demo, use the following two commands to tear down the AKS cluster and remove the cluster context from your local configuration.
time az aks delete \
  --name aks-observability-demo \
  --resource-group aks-observability-demo \
  --yes

kubectl config delete-context aks-observability-demo
Conclusion
In this brief, follow-up post, we have explored how the current set of observability tools, part of the latest version of Istio Service Mesh, integrates with Azure Kubernetes Service (AKS).
All opinions expressed in this post are my own and not necessarily the views of my current or past employers or their clients.
Kubernetes-based Microservice Observability with Istio Service Mesh on Google Kubernetes Engine (GKE): Part 2
Posted by Gary A. Stafford in Cloud, DevOps, GCP, Go, JavaScript, Kubernetes, Software Development on March 21, 2019
In this two-part post, we are exploring the set of observability tools that are part of the latest version of Istio Service Mesh. These tools include Prometheus and Grafana for metric collection, monitoring, and alerting, Jaeger for distributed tracing, and Kiali for Istio service-mesh-based microservice visualization. Combined with cloud platform-native monitoring and logging services, such as Stackdriver for Google Kubernetes Engine (GKE) on Google Cloud Platform (GCP), we have a complete observability solution for modern, distributed applications.
Reference Platform
To demonstrate Istio’s observability tools, in part one of the post, we deployed a reference microservices platform, written in Go, to GKE on GCP. The platform is comprised of (14) components, including (8) Go-based microservices, labeled generically as Service A through Service H, (1) Angular 7, TypeScript-based front-end, (4) MongoDB databases, and (1) RabbitMQ queue for event queue-based communications.
The reference platform is designed to generate HTTP-based service-to-service, TCP-based service-to-database (MongoDB), and TCP-based service-to-queue-to-service (RabbitMQ) IPC (inter-process communication). Service A calls Service B and Service C, Service B calls Service D and Service E, Service D produces a message on a RabbitMQ queue that Service F consumes and writes to MongoDB, and so on. The goal is to observe these distributed communications using Istio’s observability tools when the system is deployed to Kubernetes.
Pillar 1: Logging
If you recall, logs, metrics, and traces are often known as the three pillars of observability. Since we are using GKE on GCP, we will look at Google’s Stackdriver Logging. According to Google, Stackdriver Logging allows you to store, search, analyze, monitor, and alert on log data and events from GCP and even AWS. Although Stackdriver logging is not an Istio observability feature, logging is an essential pillar of overall observability strategy.
Go-based Microservice Logging
An effective logging strategy starts with what you log, when you log, and how you log. As part of our logging strategy, the eight Go-based microservices are using Logrus, a popular structured logger for Go. The microservices also implement Banzai Cloud’s logrus-runtime-formatter. There is an excellent article on the formatter, Golang runtime Logrus Formatter. These two logging packages give us greater control over what we log, when we log, and how we log information about our microservices. The recommended configuration of the packages is minimal.
func init() {
   formatter := runtime.Formatter{ChildFormatter: &log.JSONFormatter{}}
   formatter.Line = true
   log.SetFormatter(&formatter)
   log.SetOutput(os.Stdout)
   level, err := log.ParseLevel(getEnv("LOG_LEVEL", "info"))
   if err != nil {
      log.Error(err)
   }
   log.SetLevel(level)
}
Logrus provides several advantages over Go’s simple logging package, log. Log entries are not only for Fatal errors, nor should all verbose log entries be output in a Production environment. The post’s microservices are taking advantage of Logrus’ ability to log at seven levels: Trace, Debug, Info, Warning, Error, Fatal, and Panic. We have also variabilized the log level, allowing it to be easily changed in the Kubernetes Deployment resource at deploy-time.
The microservices also take advantage of Banzai Cloud’s logrus-runtime-formatter. The Banzai formatter automatically tags log messages with runtime/stack information, including function name and line number; extremely helpful when troubleshooting. We are also using Logrus’ JSON formatter. Note how each log entry below has the JSON payload contained within the message.

Client-side Angular UI Logging
Likewise, we have enhanced the logging of the Angular UI using NGX Logger. NGX Logger is a popular, simple logging module, currently for Angular 6 and 7. It allows “pretty print” to the console, as well as allowing log messages to be POSTed to a URL for server-side logging. For this demo, we will only print to the console. Similar to Logrus, NGX Logger supports multiple log levels: Trace, Debug, Info, Warning, Error, Fatal, and Off. Instead of just outputting messages, NGX Logger allows us to output properly formatted log entries to the web browser’s console.
The level of logs output is dependent on the environment, Production or not Production. Below we see a combination of log entries in the local development environment, including Debug, Info, and Error.

Again below, we see the same page in the GKE-based Production environment. Note the absence of Debug-level log entries output to the console, without changing the configuration. We would not want to expose potentially sensitive information in verbose log output to our end-users in Production.

Controlling logging levels is accomplished by adding the following ternary operator to the app.module.ts file.
    LoggerModule.forRoot({
      level: !environment.production ?
        NgxLoggerLevel.DEBUG : NgxLoggerLevel.INFO,
        serverLogLevel: NgxLoggerLevel.INFO
    })
Pillar 2: Metrics
For metrics, we will examine at Prometheus and Grafana. Both these leading tools were installed as part of the Istio deployment.
Prometheus
Prometheus is a completely open source and community-driven systems monitoring and alerting toolkit originally built at SoundCloud, circa 2012. Interestingly, Prometheus joined the Cloud Native Computing Foundation (CNCF) in 2016 as the second hosted-project, after Kubernetes.
According to Istio, Istio’s Mixer comes with a built-in Prometheus adapter that exposes an endpoint serving generated metric values. The Prometheus add-on is a Prometheus server that comes pre-configured to scrape Mixer endpoints to collect the exposed metrics. It provides a mechanism for persistent storage and querying of Istio metrics.
With the GKE cluster running, Istio installed, and the platform deployed, the easiest way to access Grafana, is using kubectl port-forward to connect to the Prometheus server. According to Google, Kubernetes port forwarding allows using a resource name, such as a service name, to select a matching pod to port forward to since Kubernetes v1.10. We forward a local port to a port on the Prometheus pod.

You may connect using Google Cloud Shell or copy and paste the command to your local shell to connect from a local port. Below are the port forwarding commands used in this post.
# Grafana
kubectl port-forward -n istio-system \
  $(kubectl get pod -n istio-system -l app=grafana \
  -o jsonpath='{.items[0].metadata.name}') 3000:3000 &

# Prometheus
kubectl -n istio-system port-forward \
  $(kubectl -n istio-system get pod -l app=prometheus \
  -o jsonpath='{.items[0].metadata.name}') 9090:9090 &

# Jaeger
kubectl port-forward -n istio-system \
$(kubectl get pod -n istio-system -l app=jaeger \
-o jsonpath='{.items[0].metadata.name}') 16686:16686 &

# Kiali
kubectl -n istio-system port-forward \
  $(kubectl -n istio-system get pod -l app=kiali \
  -o jsonpath='{.items[0].metadata.name}') 20001:20001 &
According to Prometheus, user select and aggregate time series data in real time using a functional query language called PromQL (Prometheus Query Language). The result of an expression can either be shown as a graph, viewed as tabular data in Prometheus’s expression browser, or consumed by external systems through Prometheus’ HTTP API. The expression browser includes a drop-down menu with all available metrics as a starting point for building queries. Shown below are a few PromQL examples used in this post.
up{namespace="dev",pod_name=~"service-.*"}

container_memory_max_usage_bytes{namespace="dev",container_name=~"service-.*"}
container_memory_max_usage_bytes{namespace="dev",container_name="service-f"}
container_network_transmit_packets_total{namespace="dev",pod_name=~"service-e-.*"}

istio_requests_total{destination_service_namespace="dev",connection_security_policy="mutual_tls",destination_app="service-a"}
istio_response_bytes_count{destination_service_namespace="dev",connection_security_policy="mutual_tls",source_app="service-a"}
Below, in the Prometheus console, we see an example graph of the eight Go-based microservices, deployed to GKE. The graph displays the container memory usage over a five minute period. For half the time period, the services were at rest. For the second half of the period, the services were under a simulated load, using hey. Viewing the memory profile of the services under load can help us determine the container memory minimums and limits, which impact Kubernetes’ scheduling of workloads on the GKE cluster. Metrics such as this might also uncover memory leaks or routing issues, such as the service below, which appears to be consuming 25-50% more memory than its peers.

Another example, below, we see a graph representing the total Istio requests to Service A in the dev Namespace, while the system was under load.

Compare the graph view above with the same metrics displayed the console view. The multiple entries reflect the multiple instances of Service A in the dev Namespace, over the five-minute period being examined. The values in the individual metric elements indicate the latest metric that was collected.

Prometheus also collects basic metrics about Istio components, Kubernetes components, and GKE cluster. Below we can view the total memory of each n1-standard-2 VM nodes in the GKE cluster.

Grafana
Grafana describes itself as the leading open source software for time series analytics. According to Grafana Labs, Grafana allows you to query, visualize, alert on, and understand your metrics no matter where they are stored. You can easily create, explore, and share visually-rich, data-driven dashboards. Grafana also users to visually define alert rules for your most important metrics. Grafana will continuously evaluate rules and can send notifications.
According to Istio, the Grafana add-on is a pre-configured instance of Grafana. The Grafana Docker base image has been modified to start with both a Prometheus data source and the Istio Dashboard installed. The base install files for Istio, and Mixer in particular, ship with a default configuration of global (used for every service) metrics. The pre-configured Istio Dashboards are built to be used in conjunction with the default Istio metrics configuration and a Prometheus back-end.
Below, we see the pre-configured Istio Workload Dashboard. This particular section of the larger dashboard has been filtered to show outbound service metrics in the dev Namespace of our GKE cluster.

Similarly, below, we see the pre-configured Istio Service Dashboard. This particular section of the larger dashboard is filtered to show client workloads metrics for the Istio Ingress Gateway in our GKE cluster.

Lastly, we see the pre-configured Istio Mesh Dashboard. This dashboard is filtered to show a table view of metrics for components deployed to our GKE cluster.

An effective observability strategy must include more than just the ability to visualize results. An effective strategy must also include the ability to detect anomalies and notify (alert) the appropriate resources or take action directly to resolve incidents. Grafana, like Prometheus, is capable of alerting and notification. You visually define alert rules for your critical metrics. Grafana will continuously evaluate metrics against the rules and send notifications when pre-defined thresholds are breached.
Prometheus supports multiple, popular notification channels, including PagerDuty, HipChat, Email, Kafka, and Slack. Below, we see a new Prometheus notification channel, which sends alert notifications to a Slack support channel.

Prometheus is able to send detailed text-based and visual notifications.

Pillar 3: Traces
According to the Open Tracing website, distributed tracing, also called distributed request tracing, is a method used to profile and monitor applications, especially those built using a microservices architecture. Distributed tracing helps pinpoint where failures occur and what causes poor performance.
According to Istio, although Istio proxies are able to automatically send spans, applications need to propagate the appropriate HTTP headers, so that when the proxies send span information, the spans can be correlated correctly into a single trace. To accomplish this, an application needs to collect and propagate the following headers from the incoming request to any outgoing requests.
x-request-idx-b3-traceidx-b3-spanidx-b3-parentspanidx-b3-sampledx-b3-flagsx-ot-span-context
The x-b3 headers originated as part of the Zipkin project. The B3 portion of the header is named for the original name of Zipkin, BigBrotherBird. Passing these headers across service calls is known as B3 propagation. According to Zipkin, these attributes are propagated in-process, and eventually downstream (often via HTTP headers), to ensure all activity originating from the same root are collected together.
In order to demonstrate distributed tracing with Jaeger, I have modified Service A, Service B, and Service E. These are the three services that make HTTP requests to other upstream services. I have added the following code in order to propagate the headers from one service to the next. The Istio sidecar proxy (Envoy) generates the first headers. It is critical that you only propagate the headers that are present in the downstream request and have a value, as the code below does. Propagating an empty header will break the distributed tracing.
headers := []string{
  "x-request-id",
  "x-b3-traceid",
  "x-b3-spanid",
  "x-b3-parentspanid",
  "x-b3-sampled",
  "x-b3-flags",
  "x-ot-span-context",
}

for _, header := range headers {
  if r.Header.Get(header) != "" {
    req.Header.Add(header, r.Header.Get(header))
  }
}
Below, in the highlighted Stackdriver log entry’s JSON payload, we see the required headers, propagated from the root span, which contained a value, being passed from Service A to Service C in the upstream request.

Jaeger
According to their website, Jaeger, inspired by Dapper and OpenZipkin, is a distributed tracing system released as open source by Uber Technologies. It is used for monitoring and troubleshooting microservices-based distributed systems, including distributed context propagation, distributed transaction monitoring, root cause analysis, service dependency analysis, and performance and latency optimization. The Jaeger website contains a good overview of Jaeger’s architecture and general tracing-related terminology.
Below we see the Jaeger UI Traces View. The UI shows the results of a search for the Istio Ingress Gateway service over a period of about forty minutes. We see a timeline of traces across the top with a list of trace results below. As discussed on the Jaeger website, a trace is composed of spans. A span represents a logical unit of work in Jaeger that has an operation name. A trace is an execution path through the system and can be thought of as a directed acyclic graph (DAG) of spans. If you have worked with systems like Apache Spark, you are probably already familiar with DAGs.

Below we see the Jaeger UI Trace Detail View. The example trace contains 16 spans, which encompasses eight services – seven of the eight Go-based services and the Istio Ingress Gateway. The trace and the spans each have timings. The root span in the trace is the Istio Ingress Gateway. The Angular UI, loaded in the end user’s web browser, calls the mesh’s edge service, Service A, through the Istio Ingress Gateway. From there, we see the expected flow of our service-to-service IPC. Service A calls Services B and C. Service B calls Service E, which calls Service G and Service H. In this demo, traces do not span the RabbitMQ message queues. This means you would not see a trace which includes a call from Service D to Service F, via the RabbitMQ.

Within the Jaeger UI Trace Detail View, you also have the ability to drill into a single span, which contains additional metadata. Metadata includes the URL being called, HTTP method, response status, and several other headers.

The latest version of Jaeger also includes a Compare feature and two Dependencies views, Force-Directed Graph, and DAG. I find both views rather primitive compared to Kiali, and more similar to Service Graph. Lacking access to Kiali, the views are marginally useful as a dependency graph.

Kiali: Microservice Observability
According to their website, Kiali provides answers to the questions: What are the microservices in my Istio service mesh, and how are they connected? There is a common Kubernetes Secret that controls access to the Kiali API and UI. The default login is admin, the password is 1f2d1e2e67df.

Logging into Kiali, we see the Overview menu entry, which provides a global view of all namespaces within the Istio service mesh and the number of applications within each namespace.

The Graph View in the Kiali UI is a visual representation of the components running in the Istio service mesh. Below, filtering on the cluster’s dev Namespace, we can observe that Kiali has mapped 8 applications (workloads), 10 services, and 24 edges (a graph term). Specifically, we see the Istio Ingres Proxy at the edge of the service mesh, the Angular UI, the eight Go-based microservices and their Envoy proxy sidecars that are taking traffic (Service F did not take any direct traffic from another service in this example), the external MongoDB Atlas cluster, and the external CloudAMQP cluster. Note how service-to-service traffic flows, with Istio, from the service to its sidecar proxy, to the other service’s sidecar proxy, and finally to the service.

Below, we see a similar view of the service mesh, but this time, there are failures between the Istio Ingress Gateway and the Service A, shown in red. We can also observe overall metrics for the HTTP traffic, such as total requests/minute, errors, and status codes.

Kiali can also display average requests times and other metrics for each edge in the graph (the communication between two components).

Kiali can also show application versions deployed, as shown below, the microservices are a combination of versions 1.3 and 1.4.

Focusing on the external MongoDB Atlas cluster, Kiali also allows us to view TCP traffic between the four services within the service mesh and the external cluster.

The Applications menu entry lists all the applications and their error rates, which can be filtered by Namespace and time interval. Here we see that the Angular UI was producing errors at the rate of 16.67%.

On both the Applications and Workloads menu entry, we can drill into a component to view additional details, including the overall health, number of Pods, Services, and Destination Services. Below, we see details for Service B in the dev Namespace.

The Workloads detailed view also includes inbound and outbound metrics. Below, the outbound volume, duration, and size metrics, for Service A in the dev Namespace.

Finally, Kiali presents an Istio Config menu entry. The Istio Config menu entry displays a list of all of the available Istio configuration objects that exist in the user’s environment.

Oftentimes, I find Kiali to be my first stop when troubleshooting platform issues. Once I identify the specific components or communication paths having issues, I can search the Stackdriver logs and the Prometheus metrics, through the Grafana dashboard.
Conclusion
In this two-part post, we have explored the current set of observability tools, which are part of the latest version of Istio Service Mesh. These tools included Prometheus and Grafana for metric collection, monitoring, and alerting, Jaeger for distributed tracing, and Kiali for Istio service-mesh-based microservice visualization. Combined with cloud platform-native monitoring and logging services, such as Stackdriver for Google Kubernetes Engine (GKE) on Google Cloud Platform (GCP), we have a complete observability solution for modern, distributed applications.
All opinions expressed in this post are my own and not necessarily the views of my current or past employers or their clients.
Kubernetes-based Microservice Observability with Istio Service Mesh on Google Kubernetes Engine (GKE): Part 1
Posted by Gary A. Stafford in Build Automation, Client-Side Development, Cloud, DevOps, GCP, Go, JavaScript, Kubernetes, Software Development on March 10, 2019
In this two-part post, we will explore the set of observability tools which are part of the Istio Service Mesh. These tools include Jaeger, Kiali, Prometheus, and Grafana. To assist in our exploration, we will deploy a Go-based, microservices reference platform to Google Kubernetes Engine, on the Google Cloud Platform.
What is Observability?
Similar to blockchain, serverless, AI and ML, chatbots, cybersecurity, and service meshes, Observability is a hot buzz word in the IT industry right now. According to Wikipedia, observability is a measure of how well internal states of a system can be inferred from knowledge of its external outputs. Logs, metrics, and traces are often known as the three pillars of observability. These are the external outputs of the system, which we may observe.
The O’Reilly book, Distributed Systems Observability, by Cindy Sridharan, does an excellent job of detailing ‘The Three Pillars of Observability’, in Chapter 4. I recommend reading this free online excerpt, before continuing. A second great resource for information on observability is honeycomb.io, a developer of observability tools for production systems, led by well-known industry thought-leader, Charity Majors. The honeycomb.io site includes articles, blog posts, whitepapers, and podcasts on observability.
As modern distributed systems grow ever more complex, the ability to observe those systems demands equally modern tooling that was designed with this level of complexity in mind. Traditional logging and monitoring systems often struggle with today’s hybrid and multi-cloud, polyglot language-based, event-driven, container-based and serverless, infinitely-scalable, ephemeral-compute platforms.
Tools like Istio Service Mesh attempt to solve the observability challenge by offering native integrations with several best-of-breed, open-source telemetry tools. Istio’s integrations include Jaeger for distributed tracing, Kiali for Istio service mesh-based microservice visualization, and Prometheus and Grafana for metric collection, monitoring, and alerting. Combined with cloud platform-native monitoring and logging services, such as Stackdriver for Google Kubernetes Engine (GKE) on Google Cloud Platform (GCP), we have a complete observability platform for modern, distributed applications.
A Reference Microservices Platform
To demonstrate the observability tools integrated with the latest version of Istio Service Mesh, we will deploy a reference microservices platform, written in Go, to GKE on GCP. I developed the reference platform to demonstrate concepts such as API management, Service Meshes, Observability, DevOps, and Chaos Engineering. The platform is comprised of (14) components, including (8) Go-based microservices, labeled generically as Service A – Service H, (1) Angular 7, TypeScript-based front-end, (4) MongoDB databases, and (1) RabbitMQ queue for event queue-based communications. The platform and all its source code is free and open source.
The reference platform is designed to generate HTTP-based service-to-service, TCP-based service-to-database (MongoDB), and TCP-based service-to-queue-to-service (RabbitMQ) IPC (inter-process communication). Service A calls Service B and Service C, Service B calls Service D and Service E, Service D produces a message on a RabbitMQ queue that Service F consumes and writes to MongoDB, and so on. These distributed communications can be observed using Istio’s observability tools when the system is deployed to a Kubernetes cluster running the Istio service mesh.
Service Responses
On the reference platform, each upstream service responds to requests from downstream services by returning a small informational JSON payload (termed a greeting in the source code).

The responses are aggregated across the service call chain, resulting in an array of service responses being returned to the edge service and on to the Angular-based UI, running in the end user’s web browser. The response aggregation feature is simply used to confirm that the service-to-service communications, Istio components, and the telemetry tools are working properly.

Each Go microservice contains a /ping and /health endpoint. The /health endpoint can be used to configure Kubernetes Liveness and Readiness Probes. Additionally, the edge service, Service A, is configured for Cross-Origin Resource Sharing (CORS) using the access-control-allow-origin: * response header. CORS allows the Angular UI, running in end user’s web browser, to call the Service A /ping endpoint, which resides in a different subdomain from UI. Shown below is the Go source code for Service A.
This file contains bidirectional Unicode text that may be interpreted or compiled differently than what appears below. To review, open the file in an editor that reveals hidden Unicode characters.
Learn more about bidirectional Unicode characters
| // author: Gary A. Stafford | |
| // site: https://programmaticponderings.com | |
| // license: MIT License | |
| // purpose: Service A | |
| package main | |
| import ( | |
| "encoding/json" | |
| "github.com/banzaicloud/logrus-runtime-formatter" | |
| "github.com/google/uuid" | |
| "github.com/gorilla/mux" | |
| "github.com/prometheus/client_golang/prometheus/promhttp" | |
| "github.com/rs/cors" | |
| log "github.com/sirupsen/logrus" | |
| "io/ioutil" | |
| "net/http" | |
| "os" | |
| "strconv" | |
| "time" | |
| ) | |
| type Greeting struct { | |
| ID string `json:"id,omitempty"` | |
| ServiceName string `json:"service,omitempty"` | |
| Message string `json:"message,omitempty"` | |
| CreatedAt time.Time `json:"created,omitempty"` | |
| } | |
| var greetings []Greeting | |
| func PingHandler(w http.ResponseWriter, r *http.Request) { | |
| w.Header().Set("Content-Type", "application/json; charset=utf-8") | |
| log.Debug(r) | |
| greetings = nil | |
| CallNextServiceWithTrace("http://service-b/api/ping", w, r) | |
| CallNextServiceWithTrace("http://service-c/api/ping", w, r) | |
| tmpGreeting := Greeting{ | |
| ID: uuid.New().String(), | |
| ServiceName: "Service-A", | |
| Message: "Hello, from Service-A!", | |
| CreatedAt: time.Now().Local(), | |
| } | |
| greetings = append(greetings, tmpGreeting) | |
| err := json.NewEncoder(w).Encode(greetings) | |
| if err != nil { | |
| log.Error(err) | |
| } | |
| } | |
| func HealthCheckHandler(w http.ResponseWriter, r *http.Request) { | |
| w.Header().Set("Content-Type", "application/json; charset=utf-8") | |
| _, err := w.Write([]byte("{\"alive\": true}")) | |
| if err != nil { | |
| log.Error(err) | |
| } | |
| } | |
| func ResponseStatusHandler(w http.ResponseWriter, r *http.Request) { | |
| params := mux.Vars(r) | |
| statusCode, err := strconv.Atoi(params["code"]) | |
| if err != nil { | |
| log.Error(err) | |
| } | |
| w.WriteHeader(statusCode) | |
| } | |
| func CallNextServiceWithTrace(url string, w http.ResponseWriter, r *http.Request) { | |
| var tmpGreetings []Greeting | |
| w.Header().Set("Content-Type", "application/json; charset=utf-8") | |
| req, err := http.NewRequest("GET", url, nil) | |
| if err != nil { | |
| log.Error(err) | |
| } | |
| // Headers must be passed for Jaeger Distributed Tracing | |
| headers := []string{ | |
| "x-request-id", | |
| "x-b3-traceid", | |
| "x-b3-spanid", | |
| "x-b3-parentspanid", | |
| "x-b3-sampled", | |
| "x-b3-flags", | |
| "x-ot-span-context", | |
| } | |
| for _, header := range headers { | |
| if r.Header.Get(header) != "" { | |
| req.Header.Add(header, r.Header.Get(header)) | |
| } | |
| } | |
| log.Info(req) | |
| client := &http.Client{} | |
| response, err := client.Do(req) | |
| if err != nil { | |
| log.Error(err) | |
| } | |
| defer response.Body.Close() | |
| body, err := ioutil.ReadAll(response.Body) | |
| if err != nil { | |
| log.Error(err) | |
| } | |
| err = json.Unmarshal(body, &tmpGreetings) | |
| if err != nil { | |
| log.Error(err) | |
| } | |
| for _, r := range tmpGreetings { | |
| greetings = append(greetings, r) | |
| } | |
| } | |
| func getEnv(key, fallback string) string { | |
| if value, ok := os.LookupEnv(key); ok { | |
| return value | |
| } | |
| return fallback | |
| } | |
| func init() { | |
| formatter := runtime.Formatter{ChildFormatter: &log.JSONFormatter{}} | |
| formatter.Line = true | |
| log.SetFormatter(&formatter) | |
| log.SetOutput(os.Stdout) | |
| level, err := log.ParseLevel(getEnv("LOG_LEVEL", "info")) | |
| if err != nil { | |
| log.Error(err) | |
| } | |
| log.SetLevel(level) | |
| } | |
| func main() { | |
| c := cors.New(cors.Options{ | |
| AllowedOrigins: []string{"*"}, | |
| AllowCredentials: true, | |
| AllowedMethods: []string{"GET", "POST", "PATCH", "PUT", "DELETE", "OPTIONS"}, | |
| }) | |
| router := mux.NewRouter() | |
| api := router.PathPrefix("/api").Subrouter() | |
| api.HandleFunc("/ping", PingHandler).Methods("GET", "OPTIONS") | |
| api.HandleFunc("/health", HealthCheckHandler).Methods("GET", "OPTIONS") | |
| api.HandleFunc("/status/{code}", ResponseStatusHandler).Methods("GET", "OPTIONS") | |
| api.Handle("/metrics", promhttp.Handler()) | |
| handler := c.Handler(router) | |
| log.Fatal(http.ListenAndServe(":80", handler)) | |
| } |
For this demonstration, the MongoDB databases will be hosted, external to the services on GCP, on MongoDB Atlas, a MongoDB-as-a-Service, cloud-based platform. Similarly, the RabbitMQ queues will be hosted on CloudAMQP, a RabbitMQ-as-a-Service, cloud-based platform. I have used both of these SaaS providers in several previous posts. Using external services will help us understand how Istio and its observability tools collect telemetry for communications between the Kubernetes cluster and external systems.
Shown below is the Go source code for Service F, This service consumers messages from the RabbitMQ queue, placed there by Service D, and writes the messages to MongoDB.
This file contains bidirectional Unicode text that may be interpreted or compiled differently than what appears below. To review, open the file in an editor that reveals hidden Unicode characters.
Learn more about bidirectional Unicode characters
| // author: Gary A. Stafford | |
| // site: https://programmaticponderings.com | |
| // license: MIT License | |
| // purpose: Service F | |
| package main | |
| import ( | |
| "bytes" | |
| "context" | |
| "encoding/json" | |
| "github.com/banzaicloud/logrus-runtime-formatter" | |
| "github.com/google/uuid" | |
| "github.com/gorilla/mux" | |
| log "github.com/sirupsen/logrus" | |
| "github.com/streadway/amqp" | |
| "go.mongodb.org/mongo-driver/mongo" | |
| "go.mongodb.org/mongo-driver/mongo/options" | |
| "net/http" | |
| "os" | |
| "time" | |
| ) | |
| type Greeting struct { | |
| ID string `json:"id,omitempty"` | |
| ServiceName string `json:"service,omitempty"` | |
| Message string `json:"message,omitempty"` | |
| CreatedAt time.Time `json:"created,omitempty"` | |
| } | |
| var greetings []Greeting | |
| func PingHandler(w http.ResponseWriter, r *http.Request) { | |
| w.Header().Set("Content-Type", "application/json; charset=utf-8") | |
| greetings = nil | |
| tmpGreeting := Greeting{ | |
| ID: uuid.New().String(), | |
| ServiceName: "Service-F", | |
| Message: "Hola, from Service-F!", | |
| CreatedAt: time.Now().Local(), | |
| } | |
| greetings = append(greetings, tmpGreeting) | |
| CallMongoDB(tmpGreeting) | |
| err := json.NewEncoder(w).Encode(greetings) | |
| if err != nil { | |
| log.Error(err) | |
| } | |
| } | |
| func HealthCheckHandler(w http.ResponseWriter, r *http.Request) { | |
| w.Header().Set("Content-Type", "application/json; charset=utf-8") | |
| _, err := w.Write([]byte("{\"alive\": true}")) | |
| if err != nil { | |
| log.Error(err) | |
| } | |
| } | |
| func CallMongoDB(greeting Greeting) { | |
| log.Info(greeting) | |
| ctx, _ := context.WithTimeout(context.Background(), 10*time.Second) | |
| client, err := mongo.Connect(ctx, options.Client().ApplyURI(os.Getenv("MONGO_CONN"))) | |
| if err != nil { | |
| log.Error(err) | |
| } | |
| defer client.Disconnect(nil) | |
| collection := client.Database("service-f").Collection("messages") | |
| ctx, _ = context.WithTimeout(context.Background(), 5*time.Second) | |
| _, err = collection.InsertOne(ctx, greeting) | |
| if err != nil { | |
| log.Error(err) | |
| } | |
| } | |
| func GetMessages() { | |
| conn, err := amqp.Dial(os.Getenv("RABBITMQ_CONN")) | |
| if err != nil { | |
| log.Error(err) | |
| } | |
| defer conn.Close() | |
| ch, err := conn.Channel() | |
| if err != nil { | |
| log.Error(err) | |
| } | |
| defer ch.Close() | |
| q, err := ch.QueueDeclare( | |
| "service-d", | |
| false, | |
| false, | |
| false, | |
| false, | |
| nil, | |
| ) | |
| if err != nil { | |
| log.Error(err) | |
| } | |
| msgs, err := ch.Consume( | |
| q.Name, | |
| "service-f", | |
| true, | |
| false, | |
| false, | |
| false, | |
| nil, | |
| ) | |
| if err != nil { | |
| log.Error(err) | |
| } | |
| forever := make(chan bool) | |
| go func() { | |
| for delivery := range msgs { | |
| log.Debug(delivery) | |
| CallMongoDB(deserialize(delivery.Body)) | |
| } | |
| }() | |
| <-forever | |
| } | |
| func deserialize(b []byte) (t Greeting) { | |
| log.Debug(b) | |
| var tmpGreeting Greeting | |
| buf := bytes.NewBuffer(b) | |
| decoder := json.NewDecoder(buf) | |
| err := decoder.Decode(&tmpGreeting) | |
| if err != nil { | |
| log.Error(err) | |
| } | |
| return tmpGreeting | |
| } | |
| func getEnv(key, fallback string) string { | |
| if value, ok := os.LookupEnv(key); ok { | |
| return value | |
| } | |
| return fallback | |
| } | |
| func init() { | |
| formatter := runtime.Formatter{ChildFormatter: &log.JSONFormatter{}} | |
| formatter.Line = true | |
| log.SetFormatter(&formatter) | |
| log.SetOutput(os.Stdout) | |
| level, err := log.ParseLevel(getEnv("LOG_LEVEL", "info")) | |
| if err != nil { | |
| log.Error(err) | |
| } | |
| log.SetLevel(level) | |
| } | |
| func main() { | |
| go GetMessages() | |
| router := mux.NewRouter() | |
| api := router.PathPrefix("/api").Subrouter() | |
| api.HandleFunc("/ping", PingHandler).Methods("GET") | |
| api.HandleFunc("/health", HealthCheckHandler).Methods("GET") | |
| log.Fatal(http.ListenAndServe(":80", router)) | |
| } |
Source Code
All source code for this post is available on GitHub in two projects. The Go-based microservices source code, all Kubernetes resources, and all deployment scripts are located in the k8s-istio-observe-backend project repository. The Angular UI TypeScript-based source code is located in the k8s-istio-observe-frontend project repository. You should not need to clone the Angular UI project for this demonstration.
git clone --branch master --single-branch --depth 1 --no-tags \
  https://github.com/garystafford/k8s-istio-observe-backend.git
Docker images referenced in the Kubernetes Deployment resource files, for the Go services and UI, are all available on Docker Hub. The Go microservice Docker images were built using the official Golang Alpine base image on DockerHub, containing Go version 1.12.0. Using the Alpine image to compile the Go source code ensures the containers will be as small as possible and contain a minimal attack surface.
System Requirements
To follow along with the post, you will need the latest version of gcloud CLI (min. ver. 239.0.0), part of the Google Cloud SDK, Helm, and the just releases Istio 1.1.0, installed and configured locally or on your build machine.

Set-up and Installation
To deploy the microservices platform to GKE, we will proceed in the following order.
- Create the MongoDB Atlas database cluster;
- Create the CloudAMQP RabbitMQ cluster;
- Modify the Kubernetes resources and scripts for your own environments;
- Create the GKE cluster on GCP;
- Deploy Istio 1.1.0 to the GKE cluster, using Helm;
- Create DNS records for the platform’s exposed resources;
- Deploy the Go-based microservices, Angular UI, and associated resources to GKE;
- Test and troubleshoot the platform;
- Observe the results in part two!
MongoDB Atlas Cluster
MongoDB Atlas is a fully-managed MongoDB-as-a-Service, available on AWS, Azure, and GCP. Atlas, a mature SaaS product, offers high-availability, guaranteed uptime SLAs, elastic scalability, cross-region replication, enterprise-grade security, LDAP integration, a BI Connector, and much more.
MongoDB Atlas currently offers four pricing plans, Free, Basic, Pro, and Enterprise. Plans range from the smallest, M0-sized MongoDB cluster, with shared RAM and 512 MB storage, up to the massive M400 MongoDB cluster, with 488 GB of RAM and 3 TB of storage.
For this post, I have created an M2-sized MongoDB cluster in GCP’s us-central1 (Iowa) region, with a single user database account for this demo. The account will be used to connect from four of the eight microservices, running on GKE.

Originally, I started with an M0-sized cluster, but the compute resources were insufficient to support the volume of calls from the Go-based microservices. I suggest at least an M2-sized cluster or larger.
CloudAMQP RabbitMQ Cluster
CloudAMQP provides full-managed RabbitMQ clusters on all major cloud and application platforms. RabbitMQ will support a decoupled, eventually consistent, message-based architecture for a portion of our Go-based microservices. For this post, I have created a RabbitMQ cluster in GCP’s us-central1 (Iowa) region, the same as our GKE cluster and MongoDB Atlas cluster. I chose a minimally-configured free version of RabbitMQ. CloudAMQP also offers robust, multi-node RabbitMQ clusters for Production use.
Modify Configurations
There are a few configuration settings you will need to change in the GitHub project’s Kubernetes resource files and Bash deployment scripts.
Istio ServiceEntry for MongoDB Atlas
Modify the Istio ServiceEntry, external-mesh-mongodb-atlas.yaml file, adding you MongoDB Atlas host address. This file allows egress traffic from four of the microservices on GKE to the external MongoDB Atlas cluster.
apiVersion: networking.istio.io/v1alpha3
kind: ServiceEntry
metadata:
  name: mongodb-atlas-external-mesh
spec:
  hosts:
  - {{ your_host_goes_here }}
  ports:
  - name: mongo
    number: 27017
    protocol: MONGO
  location: MESH_EXTERNAL
  resolution: NONE
Istio ServiceEntry for CloudAMQP RabbitMQ
Modify the Istio ServiceEntry, external-mesh-cloudamqp.yaml file, adding you CloudAMQP host address. This file allows egress traffic from two of the microservices to the CloudAMQP cluster.
apiVersion: networking.istio.io/v1alpha3
kind: ServiceEntry
metadata:
  name: cloudamqp-external-mesh
spec:
  hosts:
  - {{ your_host_goes_here }}
  ports:
  - name: rabbitmq
    number: 5672
    protocol: TCP
  location: MESH_EXTERNAL
  resolution: NONE
Istio Gateway and VirtualService Resources
There are numerous strategies you may use to route traffic into the GKE cluster, via Istio. I am using a single domain for the post, example-api.com, and four subdomains. One set of subdomains is for the Angular UI, in the dev Namespace (ui.dev.example-api.com) and the test Namespace (ui.test.example-api.com). The other set of subdomains is for the edge API microservice, Service A, which the UI calls (api.dev.example-api.com and api.test.example-api.com). Traffic is routed to specific Kubernetes Service resources, based on the URL.
According to Istio, the Gateway describes a load balancer operating at the edge of the mesh, receiving incoming or outgoing HTTP/TCP connections. Modify the Istio ingress Gateway, inserting your own domains or subdomains in the hosts section. These are the hosts on port 80 that will be allowed into the mesh.
apiVersion: networking.istio.io/v1alpha3
kind: Gateway
metadata:
  name: demo-gateway
spec:
  selector:
    istio: ingressgateway
  servers:
  - port:
      number: 80
      name: http
      protocol: HTTP
    hosts:
    - ui.dev.example-api.com
    - ui.test.example-api.com
    - api.dev.example-api.com
    - api.test.example-api.com
According to Istio, a VirtualService defines a set of traffic routing rules to apply when a host is addressed. A VirtualService is bound to a Gateway to control the forwarding of traffic arriving at a particular host and port. Modify the project’s four Istio VirtualServices, inserting your own domains or subdomains. Here is an example of one of the four VirtualServices, in the istio-gateway.yaml file.
apiVersion: networking.istio.io/v1alpha3
kind: VirtualService
metadata:
  name: angular-ui-dev
spec:
  hosts:
  - ui.dev.example-api.com
  gateways:
  - demo-gateway
  http:
  - match:
    - uri:
        prefix: /
    route:
    - destination:
        port:
          number: 80
        host: angular-ui.dev.svc.cluster.local
Kubernetes Secret
The project contains a Kubernetes Secret, go-srv-demo.yaml, with two values. One is for the MongoDB Atlas connection string and one is for the CloudAMQP connections string. Remember Kubernetes Secret values need to be base64 encoded.
apiVersion: v1
kind: Secret
metadata:
  name: go-srv-config
type: Opaque
data:
  mongodb.conn: {{ your_base64_encoded_secret }}
  rabbitmq.conn: {{ your_base64_encoded_secret }}
On Linux and Mac, you can use the base64 program to encode the connection strings.
> echo -n "mongodb+srv://username:password@atlas-cluster.gcp.mongodb.net/test?retryWrites=true" | base64
bW9uZ29kYitzcnY6Ly91c2VybmFtZTpwYXNzd29yZEBhdGxhcy1jbHVzdGVyLmdjcC5tb25nb2RiLm5ldC90ZXN0P3JldHJ5V3JpdGVzPXRydWU=

> echo -n "amqp://username:password@rmq.cloudamqp.com/cluster" | base64
YW1xcDovL3VzZXJuYW1lOnBhc3N3b3JkQHJtcS5jbG91ZGFtcXAuY29tL2NsdXN0ZXI=
Bash Scripts Variables
The bash script, part3_create_gke_cluster.sh, contains a series of environment variables. At a minimum, you will need to change the PROJECT variable in all scripts to match your GCP project name.
# Constants - CHANGE ME!
readonly PROJECT='{{ your_gcp_project_goes_here }}'
readonly CLUSTER='go-srv-demo-cluster'
readonly REGION='us-central1'
readonly MASTER_AUTH_NETS='72.231.208.0/24'
readonly GKE_VERSION='1.12.5-gke.5'
readonly MACHINE_TYPE='n1-standard-2'
The bash script, part4_install_istio.sh, includes the ISTIO_HOME variable. The value should correspond to your local path to Istio 1.1.0. On my local Mac, this value is shown below.
readonly ISTIO_HOME='/Applications/istio-1.1.0'
Deploy GKE Cluster
Next, deploy the GKE cluster using the included bash script, part3_create_gke_cluster.sh. This will create a Regional, multi-zone, 3-node GKE cluster, using the latest version of GKE at the time of this post, 1.12.5-gke.5. The cluster will be deployed to the same region as the MongoDB Atlas and CloudAMQP clusters, GCP’s us-central1 (Iowa) region. Planning where your Cloud resources will reside, for both SaaS providers and primary Cloud providers can be critical to minimizing latency for network I/O intensive applications.

Deploy Istio using Helm
With the GKE cluster and associated infrastructure in place, deploy Istio. For this post, I have chosen to install Istio using Helm, as recommended my Istio. To deploy Istio using Helm, use the included bash script, part4_install_istio.sh.

The script installs Istio, using the Helm Chart in the local Istio 1.1.0 install/kubernetes/helm/istio directory, which you installed as a requirement for this demonstration. The Istio install script overrides several default values in the Istio Helm Chart using the --set, flag. The list of available configuration values is detailed in the Istio Chart’s GitHub project. The options enable Istio’s observability features, which we will explore in part two. Features include Kiali, Grafana, Prometheus, and Jaeger.
helm install ${ISTIO_HOME}/install/kubernetes/helm/istio-init \
  --name istio-init \
  --namespace istio-system

helm install ${ISTIO_HOME}/install/kubernetes/helm/istio \
  --name istio \
  --namespace istio-system \
  --set prometheus.enabled=true \
  --set grafana.enabled=true \
  --set kiali.enabled=true \
  --set tracing.enabled=true

kubectl apply --namespace istio-system \
  -f ./resources/secrets/kiali.yaml
Below, we see the Istio-related Workloads running on the cluster, including the observability tools.

Below, we see the corresponding Istio-related Service resources running on the cluster.

Modify DNS Records
Instead of using IP addresses to route traffic the GKE cluster and its applications, we will use DNS. As explained earlier, I have chosen a single domain for the post, example-api.com, and four subdomains. One set of subdomains is for the Angular UI, in the dev Namespace and the test Namespace. The other set of subdomains is for the edge microservice, Service A, which the API calls. Traffic is routed to specific Kubernetes Service resources, based on the URL.
Deploying the GKE cluster and Istio triggers the creation of a Google Load Balancer, four IP addresses, and all required firewall rules. One of the four IP addresses, the one shown below, associated with the Forwarding rule, will be associated with the front-end of the load balancer.
Below, we see the new load balancer, with the front-end IP address and the backend VM pool of three GKE cluster’s worker nodes. Each node is assigned one of the IP addresses, as shown above.

As shown below, using Google Cloud DNS, I have created the four subdomains and assigned the IP address of the load balancer’s front-end to all four subdomains. Ingress traffic to these addresses will be routed through the Istio ingress Gateway and the four Istio VirtualServices, to the appropriate Kubernetes Service resources. Use your choice of DNS management tools to create the four A Type DNS records.

Deploy the Reference Platform
Next, deploy the eight Go-based microservices, the Angular UI, and the associated Kubernetes and Istio resources to the GKE cluster. To deploy the platform, use the included bash deploy script, part5a_deploy_resources.sh. If anything fails and you want to remove the existing resources and re-deploy, without destroying the GKE cluster or Istio, you can use the part5b_delete_resources.sh delete script.

The deploy script deploys all the resources two Kubernetes Namespaces, dev and test. This will allow us to see how we can differentiate between Namespaces when using the observability tools.
Below, we see the Istio-related resources, which we just deployed. They include the Istio Gateway, four Istio VirtualService, and two Istio ServiceEntry resources.

Below, we see the platform’s Workloads (Kubernetes Deployment resources), running on the cluster. Here we see two Pods for each Workload, a total of 18 Pods, running in the dev Namespace. Each Pod contains both the deployed microservice or UI component, as well as a copy of Istio’s Envoy Proxy.

Below, we see the corresponding Kubernetes Service resources running in the dev Namespace.

Below, a similar view of the Deployment resources running in the test Namespace. Again, we have two Pods for each deployment with each Pod contains both the deployed microservice or UI component, as well as a copy of Istio’s Envoy Proxy.

Test the Platform
We do want to ensure the platform’s eight Go-based microservices and Angular UI are working properly, communicating with each other, and communicating with the external MongoDB Atlas and CloudAMQP RabbitMQ clusters. The easiest way to test the cluster is by viewing the Angular UI in a web browser.
The UI requires you to input the host domain of the Service A, the API’s edge service. Since you cannot use my subdomain, and the JavaScript code is running locally to your web browser, this option allows you to provide your own host domain. This is the same domain or domains you inserted into the two Istio VirtualService for the UI. This domain route your API calls to either the FQDN (fully qualified domain name) of the Service A Kubernetes Service running in the dev namespace, service-a.dev.svc.cluster.local, or the test Namespace, service-a.test.svc.cluster.local.

You can also use performance testing tools to load-test the platform. Many issues will not show up until the platform is under load. I recently starting using hey, a modern load generator tool, as a replacement for Apache Bench (ab), Unlike ab, hey supports HTTP/2 endpoints, which is required to test the platform on GKE with Istio. Below, I am running hey directly from Google Cloud Shell. The tool is simulating 25 concurrent users, generating a total of 1,000 HTTP/2-based GET requests to Service A.

Troubleshooting
If for some reason the UI fails to display, or the call from the UI to the API fails, and assuming all Kubernetes and Istio resources are running on the GKE cluster (all green), the most common explanation is usually a misconfiguration of the following resources:
- Your four Cloud DNS records are not correct. They are not pointing to the load balancer’s front-end IP address;
- You did not configure the four Kubernetes
VirtualServiceresources with the correct subdomains; - The GKE-based microservices cannot reach the external MongoDB Atlas and CloudAMQP RabbitMQ clusters. Likely, the Kubernetes
Secretis constructed incorrectly, or the twoServiceEntryresources contain the wrong host information for those external clusters;
I suggest starting the troubleshooting by calling Service A, the API’s edge service, directly, using cURL or Postman. You should see a JSON response payload, similar to the following. This suggests the issue is with the UI, not the API.

Next, confirm that the four MongoDB databases were created for Service D, Service, F, Service, G, and Service H. Also, confirm that new documents are being written to the database’s collections.

Next, confirm new the RabbitMQ queue was created, using the CloudAMQP RabbitMQ Management Console. Service D produces messages, which Service F consumes from the queue.

Lastly, review the Stackdriver logs to see if there are any obvious errors.

Part Two
In part two of this post, we will explore each observability tool, and see how they can help us manage our GKE cluster and the reference platform running in the cluster.

Since the cluster only takes minutes to fully create and deploy resources to, if you want to tear down the GKE cluster, run the part6_tear_down.sh script.

All opinions expressed in this post are my own and not necessarily the views of my current or past employers or their clients.
Gary Stafford
AWS Area Principal Solutions Architect | 10x AWS Certified Pro | DevOps | Data/ML | Serverless | Polyglot Developer | Former ThoughtWorks and Accenture
