Posts Tagged Streaming Analytics
Exploring Popular Open-source Stream Processing Technologies: Part 2 of 2
Posted by Gary A. Stafford in Analytics, Big Data, Java Development, Python, Software Development, SQL on September 26, 2022
A brief demonstration of Apache Spark Structured Streaming, Apache Kafka Streams, Apache Flink, and Apache Pinot with Apache Superset
Introduction
According to TechTarget, “Stream processing is a data management technique that involves ingesting a continuous data stream to quickly analyze, filter, transform or enhance the data in real-time. Once processed, the data is passed off to an application, data store, or another stream processing engine.” Confluent, a fully-managed Apache Kafka market leader, defines stream processing as “a software paradigm that ingests, processes, and manages continuous streams of data while they’re still in motion.”
This two-part post series and forthcoming video explore four popular open-source software (OSS) stream processing projects: Apache Spark Structured Streaming, Apache Kafka Streams, Apache Flink, and Apache Pinot.

This post uses the open-source projects, making it easier to follow along with the demonstration and keeping costs to a minimum. However, you could easily substitute the open-source projects for your preferred SaaS, CSP, or COSS service offerings.
Part Two
We will continue our exploration in part two of this two-part post, covering Apache Flink and Apache Pinot. In addition, we will incorporate Apache Superset into the demonstration to visualize the real-time results of our stream processing pipelines as a dashboard.
Demonstration #3: Apache Flink
In the third demonstration of four, we will examine Apache Flink. For this part of the post, we will also use the third of the three GitHub repository projects, flink-kafka-demo. The project contains a Flink application written in Java, which performs stream processing, incremental aggregation, and multi-stream joins.

New Streaming Stack
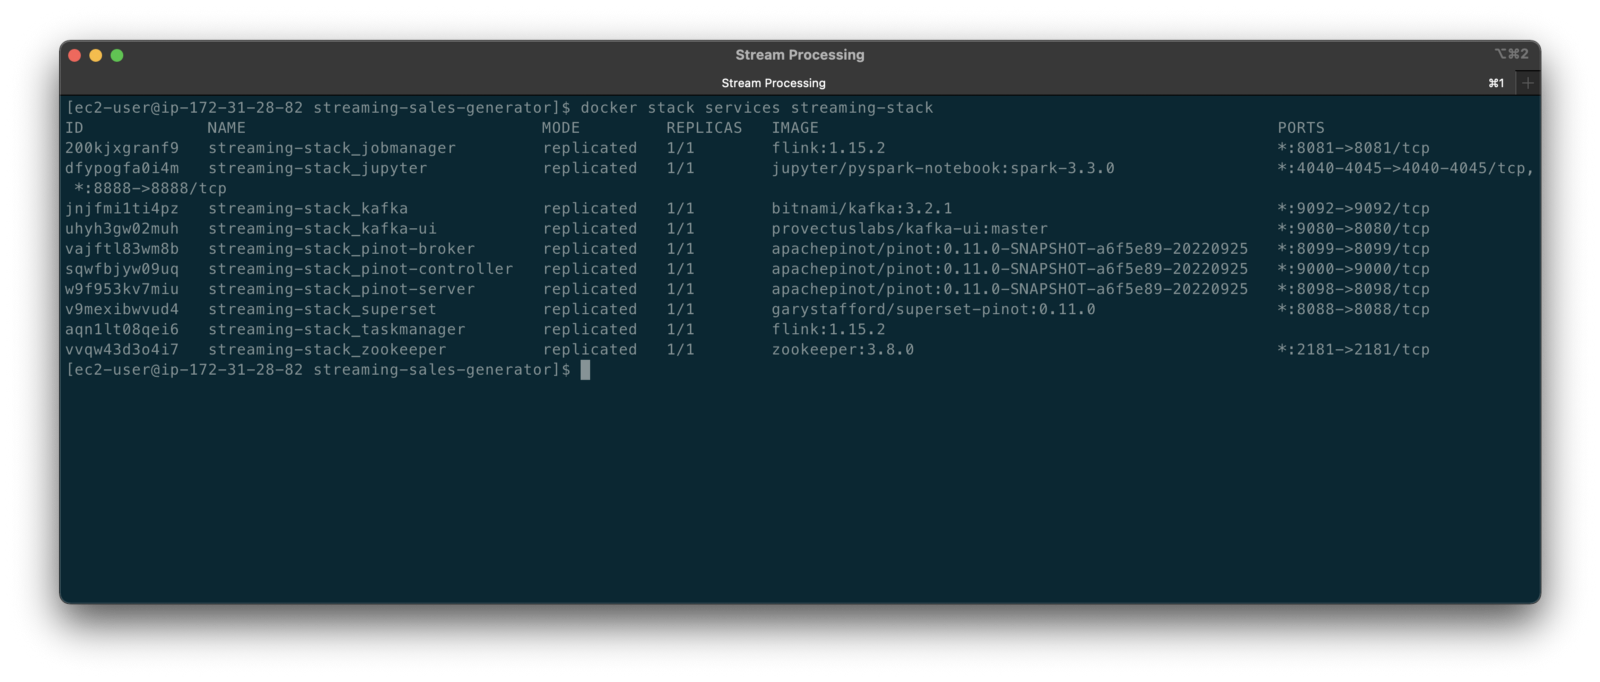
To get started, we need to replace the first streaming Docker Swarm stack, deployed in part one, with the second streaming Docker Swarm stack. The second stack contains Apache Kafka, Apache Zookeeper, Apache Flink, Apache Pinot, Apache Superset, UI for Apache Kafka, and Project Jupyter (JupyterLab).
https://programmaticponderings.wordpress.com/media/601efca17604c3a467a4200e93d7d3ff
The stack will take a few minutes to deploy fully. When complete, there should be ten containers running in the stack.
Flink Application
The Flink application has two entry classes. The first class, RunningTotals, performs an identical aggregation function as the previous KStreams demo.
The second class, JoinStreams, joins the stream of data from the demo.purchases topic and the demo.products topic, processing and combining them, in real-time, into an enriched transaction and publishing the results to a new topic, demo.purchases.enriched.
The resulting enriched purchases messages look similar to the following:
Running the Flink Job
To run the Flink application, we must first compile it into an uber JAR.
We can copy the JAR into the Flink container or upload it through the Apache Flink Dashboard, a browser-based UI. For this demonstration, we will upload it through the Apache Flink Dashboard, accessible on port 8081.
The project’s build.gradle file has preset the Main class (Flink’s Entry class) to org.example.JoinStreams. Optionally, to run the Running Totals demo, we could change the build.gradle file and recompile, or simply change Flink’s Entry class to org.example.RunningTotals.

Before running the Flink job, restart the sales generator in the background (nohup python3 ./producer.py &) to generate a new stream of data. Then start the Flink job.

To confirm the Flink application is running, we can check the contents of the new demo.purchases.enriched topic using the Kafka CLI.

Alternatively, you can use the UI for Apache Kafka, accessible on port 9080.

Demonstration #4: Apache Pinot
In the fourth and final demonstration, we will explore Apache Pinot. First, we will query the unbounded data streams from Apache Kafka, generated by both the sales generator and the Apache Flink application, using SQL. Then, we build a real-time dashboard in Apache Superset, with Apache Pinot as our datasource.

Creating Tables
According to the Apache Pinot documentation, “a table is a logical abstraction that represents a collection of related data. It is composed of columns and rows (known as documents in Pinot).” There are three types of Pinot tables: Offline, Realtime, and Hybrid. For this demonstration, we will create three Realtime tables. Realtime tables ingest data from streams — in our case, Kafka — and build segments from the consumed data. Further, according to the documentation, “each table in Pinot is associated with a Schema. A schema defines what fields are present in the table along with the data types. The schema is stored in Zookeeper, along with the table configuration.”
Below, we see the schema and config for one of the three Realtime tables, purchasesEnriched. Note how the columns are divided into three categories: Dimension, Metric, and DateTime.
To begin, copy the three Pinot Realtime table schemas and configurations from the streaming-sales-generator GitHub project into the Apache Pinot Controller container. Next, use a docker exec command to call the Pinot Command Line Interface’s (CLI) AddTable command to create the three tables: products, purchases, and purchasesEnriched.
To confirm the three tables were created correctly, use the Apache Pinot Data Explorer accessible on port 9000. Use the Tables tab in the Cluster Manager.

We can further inspect and edit the table’s config and schema from the Tables tab in the Cluster Manager.

The three tables are configured to read the unbounded stream of data from the corresponding Kafka topics: demo.products, demo.purchases, and demo.purchases.enriched.
Querying with Pinot
We can use Pinot’s Query Console to query the Realtime tables using SQL. According to the documentation, “Pinot provides a SQL interface for querying. It uses the [Apache] Calcite SQL parser to parse queries and uses MYSQL_ANSI dialect.”

With the generator still running, re-query the purchases table in the Query Console (select count(*) from purchases). You should notice the document count increasing each time you re-run the query since new messages are published to the demo.purchases topic by the sales generator.
If you do not observe the count increasing, ensure the sales generator and Flink enrichment job are running.

Table Joins?
It might seem logical to want to replicate the same multi-stream join we performed with Apache Flink in part three of the demonstration on the demo.products and demo.purchases topics. Further, we might presume to join the products and purchases realtime tables by writing a SQL statement in Pinot’s Query Console. However, according to the documentation, at the time of this post, version 0.11.0 of Pinot did not [currently] support joins or nested subqueries.
This current join limitation is why we created the Realtime table, purchasesEnriched, allowing us to query Flink’s real-time results in the demo.purchases.enriched topic. We will use both Flink and Pinot as part of our stream processing pipeline, taking advantage of each tool’s individual strengths and capabilities.
Note, according to the documentation for the latest release of Pinot on the main branch, “the latest Pinot multi-stage supports inner join, left-outer, semi-join, and nested queries out of the box. It is optimized for in-memory process and latency.” For more information on joins as part of Pinot’s new multi-stage query execution engine, read the documentation, Multi-Stage Query Engine.

demo.purchases.enriched topic in real-timeAggregations
We can perform real-time aggregations using Pinot’s rich SQL query interface. For example, like previously with Spark and Flink, we can calculate running totals for the number of items sold and the total sales for each product in real time.

We can do the same with the purchasesEnriched table, which will use the continuous stream of enriched transaction data from our Apache Flink application. With the purchasesEnriched table, we can add the product name and product category for richer results. Each time we run the query, we get real-time results based on the running sales generator and Flink enrichment job.

Query Options and Indexing
Note the reference to the Star-Tree index at the start of the SQL query shown above. Pinot provides several query options, including useStarTree (true by default).
Multiple indexing techniques are available in Pinot, including Forward Index, Inverted Index, Star-tree Index, Bloom Filter, and Range Index, among others. Each has advantages in different query scenarios. According to the documentation, by default, Pinot creates a dictionary-encoded forward index for each column.
SQL Examples
Here are a few examples of SQL queries you can try in Pinot’s Query Console:
Troubleshooting Pinot
If have issues with creating the tables or querying the real-time data, you can start by reviewing the Apache Pinot logs:
Real-time Dashboards with Apache Superset
To display the real-time stream of data produced results of our Apache Flink stream processing job and made queriable by Apache Pinot, we can use Apache Superset. Superset positions itself as “a modern data exploration and visualization platform.” Superset allows users “to explore and visualize their data, from simple line charts to highly detailed geospatial charts.”
According to the documentation, “Superset requires a Python DB-API database driver and a SQLAlchemy dialect to be installed for each datastore you want to connect to.” In the case of Apache Pinot, we can use pinotdb as the Python DB-API and SQLAlchemy dialect for Pinot. Since the existing Superset Docker container does not have pinotdb installed, I have built and published a Docker Image with the driver and deployed it as part of the second streaming stack of containers.
First, we much configure the Superset container instance. These instructions are documented as part of the Superset Docker Image repository.
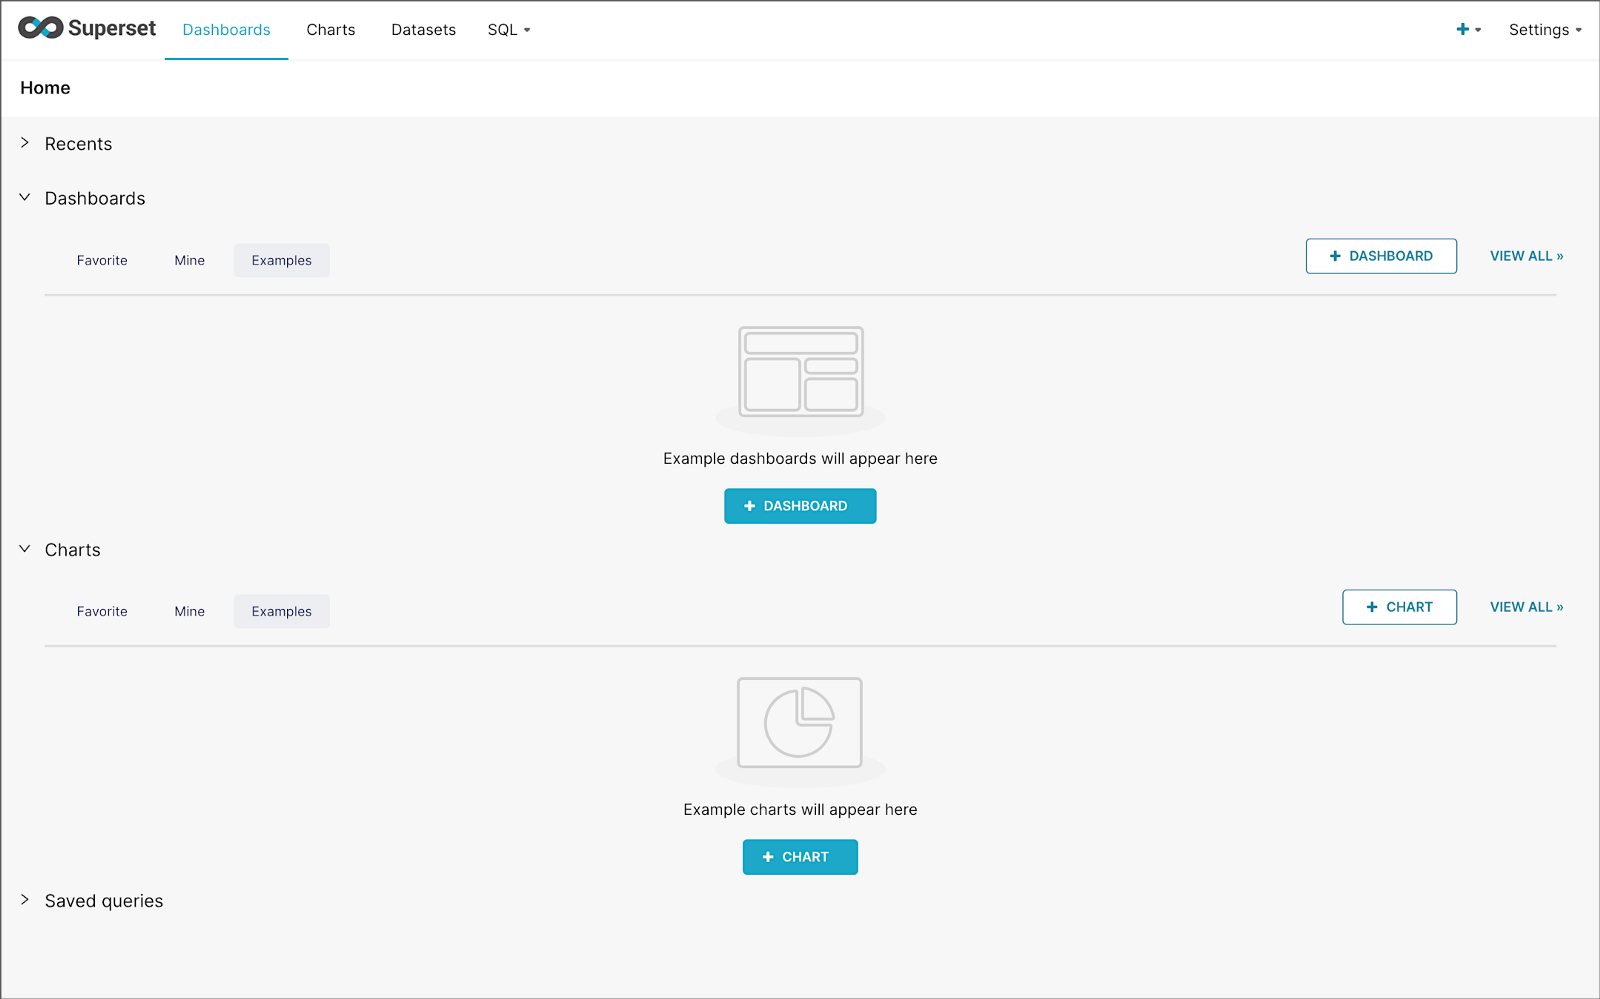
Once the configuration is complete, we can log into the Superset web-browser-based UI accessible on port 8088.
Pinot Database Connection and Dataset
Next, to connect to Pinot from Superset, we need to create a Database Connection and a Dataset.
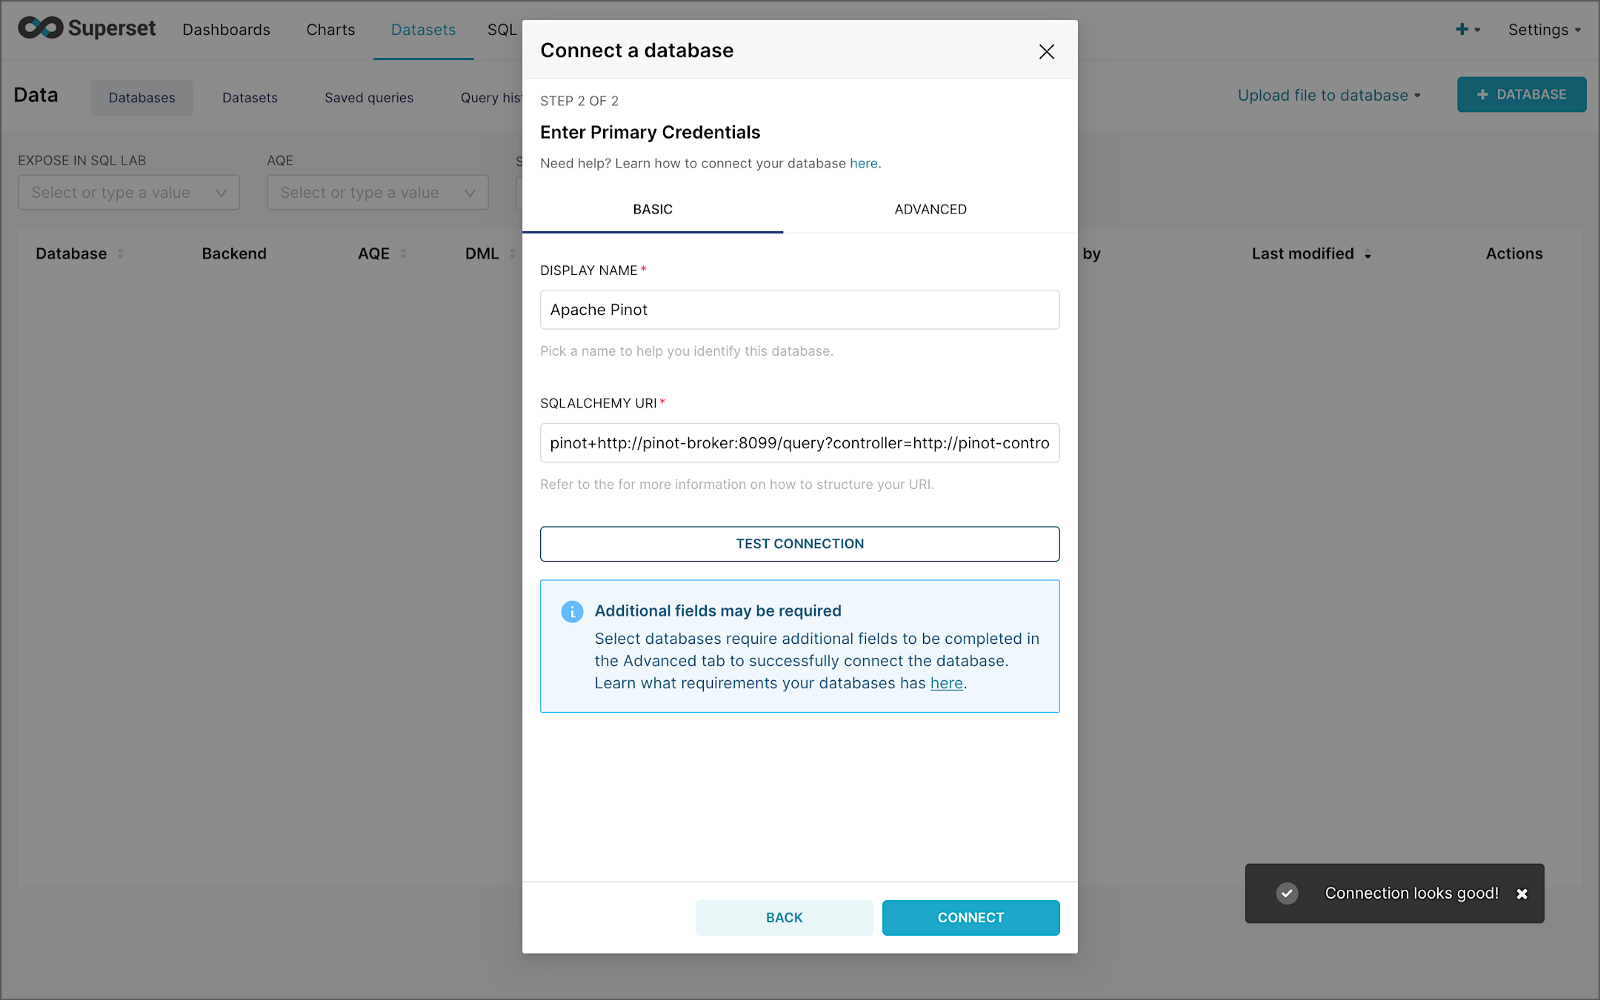
The SQLAlchemy URI is shown below. Input the URI, test your connection (‘Test Connection’), make sure it succeeds, then hit ‘Connect’.
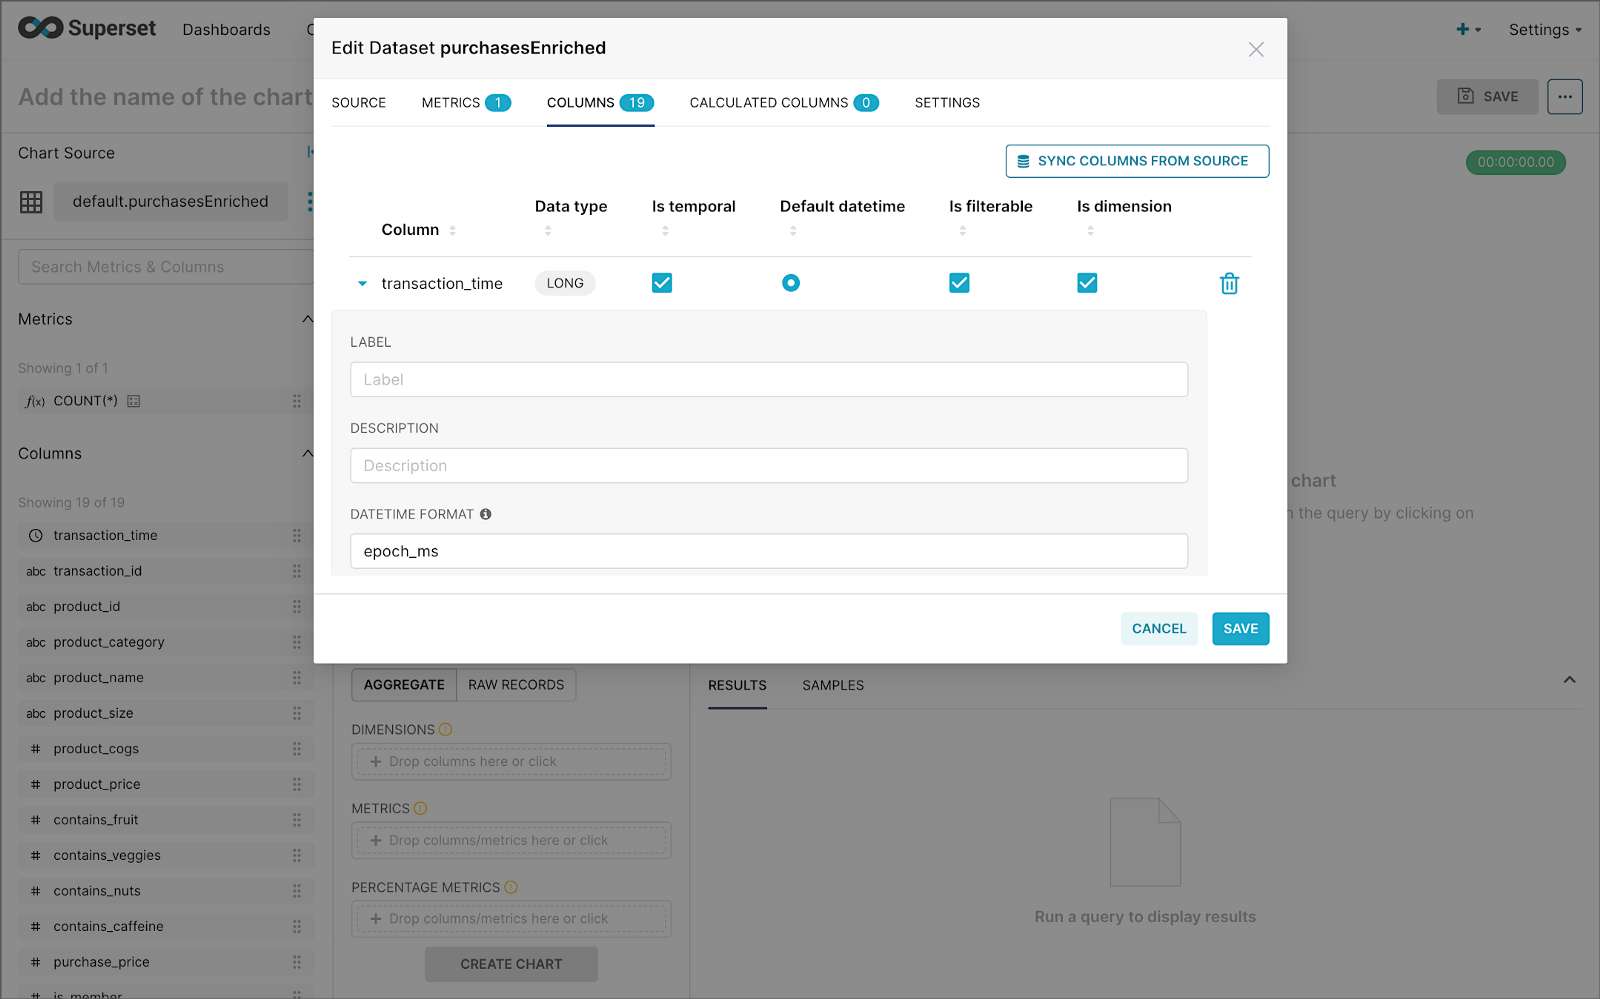
Next, create a Dataset that references the purchasesEnriched Pinot table.

purchasesEnriched Pinot tableModify the dataset’s transaction_time column. Check the is_temporal and Default datetime options. Lastly, define the DateTime format as epoch_ms.
transaction_time columnBuilding a Real-time Dashboard
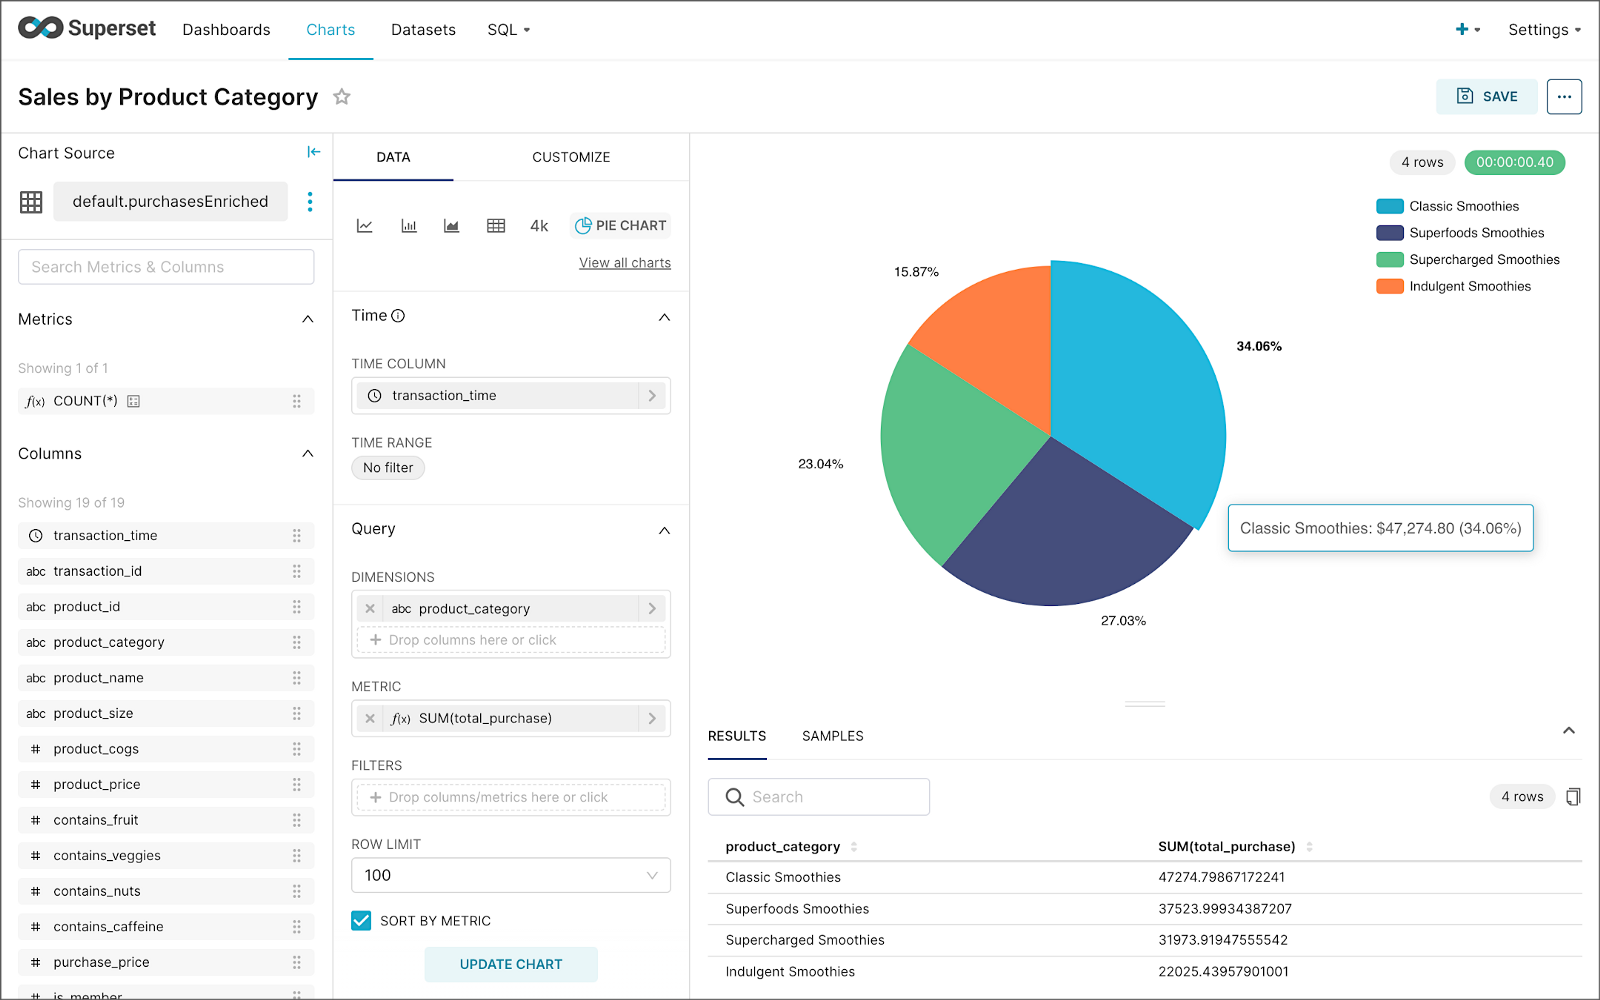
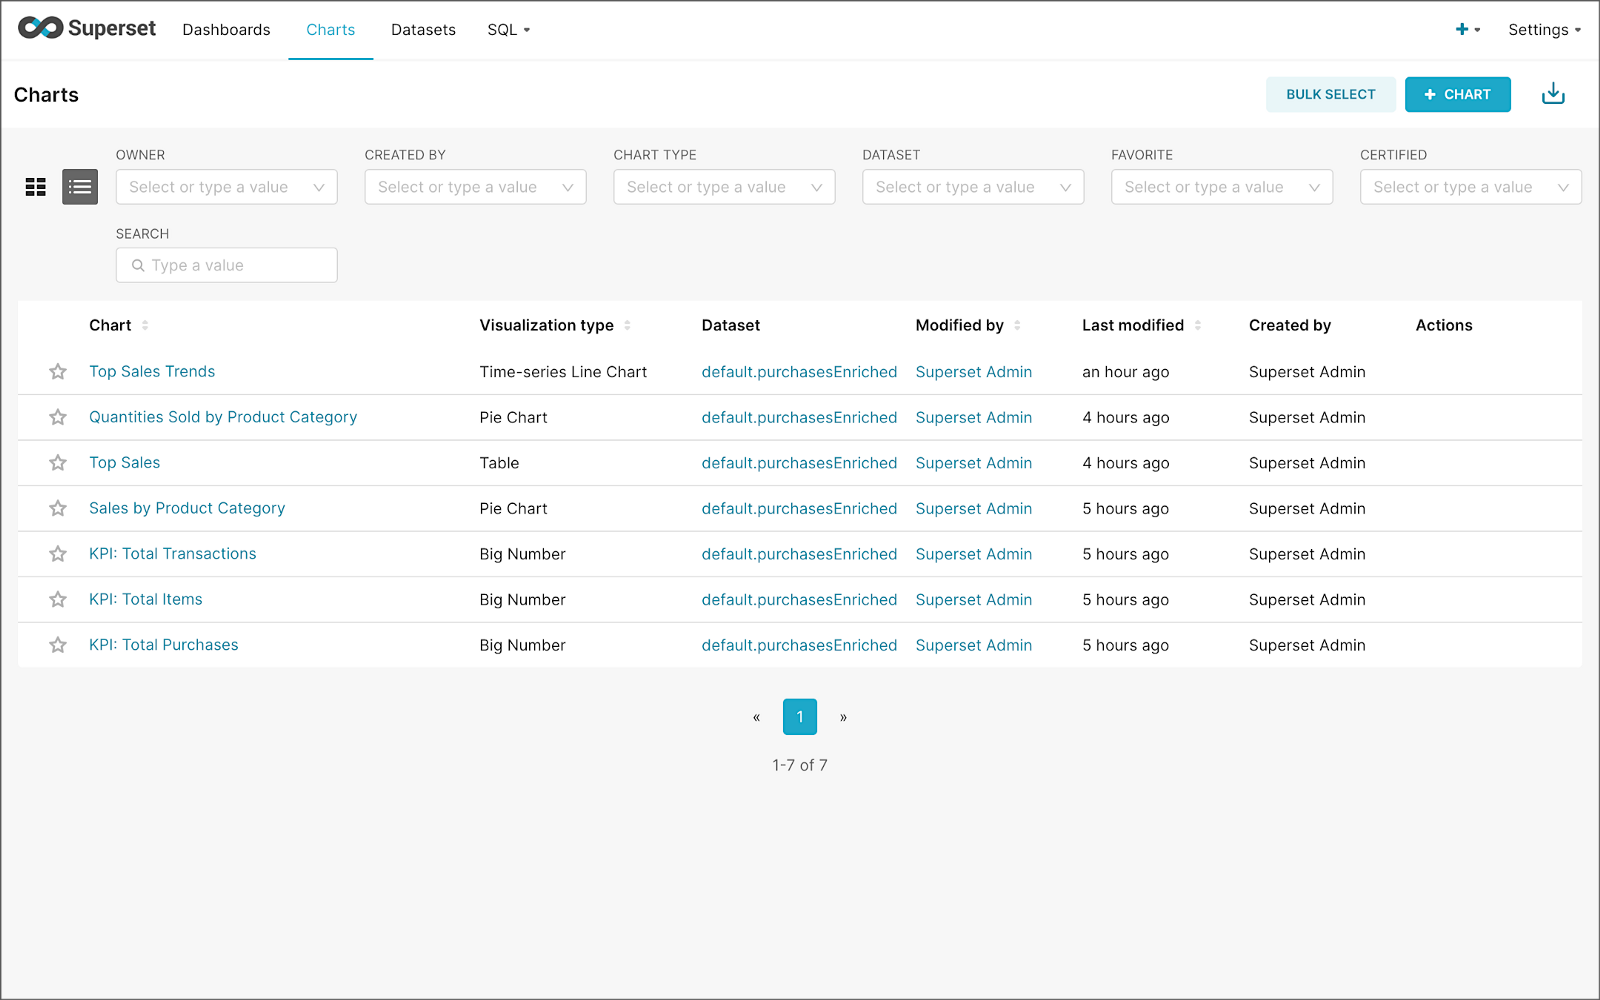
Using the new dataset, which connects Superset to the purchasesEnriched Pinot table, we can construct individual charts to be placed on a dashboard. Build a few charts to include on your dashboard.
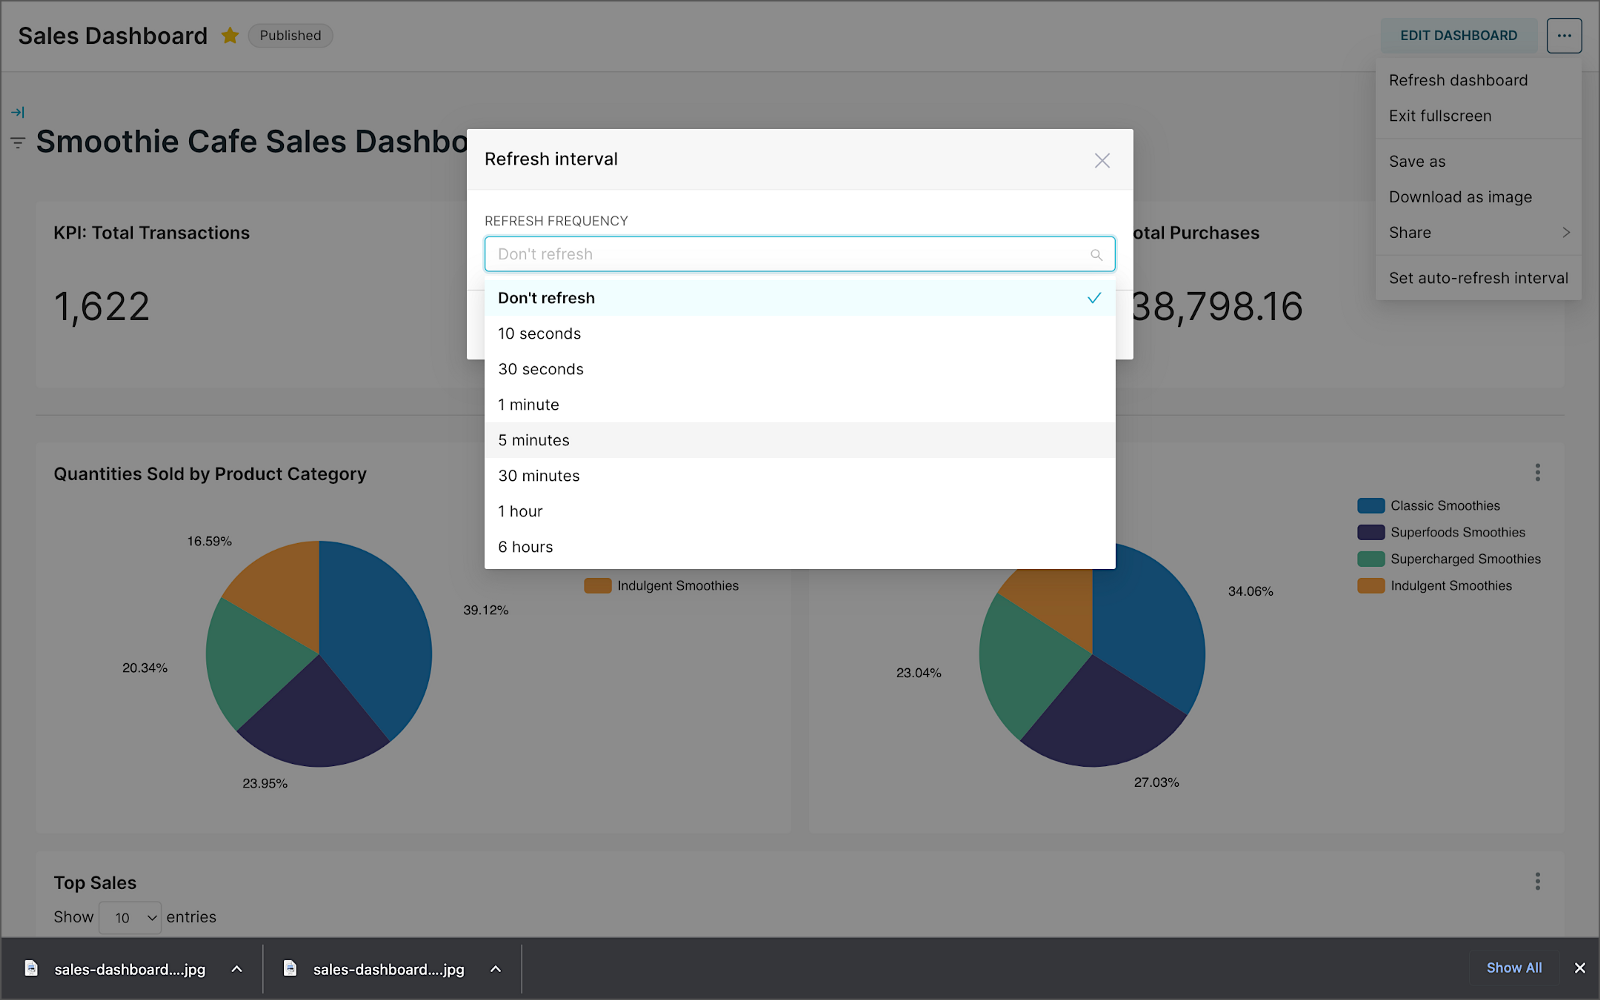
Create a new Superset dashboard and add the charts and other elements, such as headlines, dividers, and tabs.

We can apply a refresh interval to the dashboard to continuously query Pinot and visualize the results in near real-time.
Conclusion
In this two-part post series, we were introduced to stream processing. We explored four popular open-source stream processing projects: Apache Spark Structured Streaming, Apache Kafka Streams, Apache Flink, and Apache Pinot. Next, we learned how we could solve similar stream processing and streaming analytics challenges using different streaming technologies. Lastly, we saw how these technologies, such as Kafka, Flink, Pinot, and Superset, could be integrated to create effective stream processing pipelines.
This blog represents my viewpoints and not of my employer, Amazon Web Services (AWS). All product names, logos, and brands are the property of their respective owners. All diagrams and illustrations are the property of the author unless otherwise noted.
Gary Stafford
AWS Area Principal Solutions Architect | 10x AWS Certified Pro | DevOps | Data/ML | Serverless | Polyglot Developer | Former ThoughtWorks and Accenture
